United Healthcare 2007 Annual Report Download - page 27
Download and view the complete annual report
Please find page 27 of the 2007 United Healthcare annual report below. You can navigate through the pages in the report by either clicking on the pages listed below, or by using the keyword search tool below to find specific information within the annual report.-
 1
1 -
2
-
3
-
4
-
5
-
6
-
7
-
8
-
9
-
10
-
11
-
12
-
13
-
14
-
15
-
16
-
 17
17 -
 18
18 -
 19
19 -
 20
20 -
 21
21 -
 22
22 -
 23
23 -
 24
24 -
 25
25 -
 26
26 -
 27
27 -
 28
28 -
 29
29 -
 30
30 -
 31
31 -
 32
32 -
 33
33 -
 34
34 -
 35
35 -
 36
36 -
 37
37 -
38
-
39
-
40
-
41
-
42
-
43
-
44
-
45
-
46
-
47
-
48
-
49
-
50
-
51
-
52
-
53
-
54
-
55
-
56
-
57
-
58
-
59
-
60
-
61
-
62
-
63
-
64
-
65
-
66
-
67
-
68
-
69
-
70
-
71
-
72
-
73
-
74
-
75
-
76
-
77
-
78
-
79
-
80
-
81
-
82
-
83
-
84
-
85
-
86
-
87
-
88
-
89
-
90
-
91
-
92
-
93
-
94
-
95
-
96
-
97
-
98
-
99
-
100
-
101
-
102
-
103
-
104
-
105
-
106
 |
 |

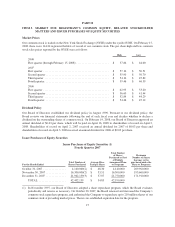
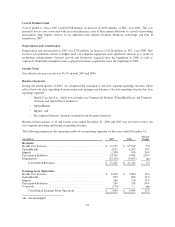
The following table summarizes the number of individuals served by Health Care Services, by major market
segment and funding arrangement, as of December 31:
(in thousands) 2007 2006
Commercial Risk-based ...................................................... 10,805 11,285
Commercial Fee-based ....................................................... 14,720 14,415
Total Commercial ....................................................... 25,525 25,700
Medicare Advantage ......................................................... 1,370 1,445
Medicaid .................................................................. 1,710 1,465
Standardized Medicare Supplement ............................................. 2,400 2,275
Total Public and Senior ................................................... 5,480 5,185
Total Health Care Services Medical Benefits .................................. 31,005 30,885
The number of individuals served with commercial products as of December 31, 2007 decreased by 175,000, or
1%, from the prior year. The number of individuals served with commercial fee-based products as of
December 31, 2007 increased by 305,000, or 2%, over 2006 driven by new customer relationships and customers
converting from risk-based products to fee-based products, partially offset by employment attrition at continuing
customers. The number of individuals served with commercial risk-based products decreased by 480,000, or 4%,
primarily due to a competitive pricing environment and the conversion of individuals to fee-based products.
The number of individuals served by Medicare Advantage products as of December 31, 2007 decreased by
75,000, or 5%, from 2006, primarily due to a decline in participation in private-fee-for-service offerings, while
individuals served by standardized Medicare supplement products increased by 125,000, or 5%, due to new
customer relationships. Medicaid enrollment increased 245,000, or 17%, in 2007 primarily due to new customer
gains, including 180,000 individuals served under the TennCare program in Tennessee.
OptumHealth
OptumHealth provides health, well-being and financial services to people and organizations nationwide through
personalized health advocacy and engagement, specialized benefits such as behavioral, dental and vision
offerings, and health-based financial services. OptumHealth revenues of $4.9 billion increased by $579 million,
or 13%, over 2006. This increase was principally driven by an increase in the number of individuals served by
several of its specialty benefit businesses and rate increases related to these businesses.
OptumHealth earnings from operations in 2007 of $895 million increased $86 million, or 11%, over 2006
primarily due to the membership growth and rate increases discussed above. The OptumHealth operating margin
declined from 18.6% in 2006 to 18.2% in 2007 due to a continued business mix shift toward higher revenue,
lower margin products, partially offset by effective operating cost management.
Ingenix
Ingenix offers solutions to a spectrum of health care market participants on a national and international basis,
including data management services, software products, publications, consulting and actuarial services, business
process outsourcing services, clinical research outsourcing, pharmaceutical data and consulting services, and
revenue cycle management solutions. Ingenix revenues for 2007 of $1.3 billion increased by $348 million, or
36%, over 2006. This was primarily driven by new business growth in the health information and contract
research businesses as well as from businesses acquired since the beginning of 2006.
Ingenix earnings from operations in 2007 were $266 million, up $90 million, or 51%, from 2006. This increase in
earnings from operations was primarily due to growth in the health information and contract research businesses,
businesses acquired since the beginning of 2006 and effective operating cost management. The operating margin
25