U-Haul 2008 Annual Report Download - page 61
Download and view the complete annual report
Please find page 61 of the 2008 U-Haul annual report below. You can navigate through the pages in the report by either clicking on the pages listed below, or by using the keyword search tool below to find specific information within the annual report.-
 1
1 -
2
-
3
-
4
-
5
-
6
-
7
-
8
-
9
-
10
-
11
-
12
-
13
-
14
-
15
-
16
-
17
-
18
-
19
-
20
-
21
-
22
-
23
-
24
-
25
-
26
-
27
-
28
-
29
-
30
-
31
-
32
-
33
-
34
-
35
-
36
-
37
-
38
-
39
-
40
-
41
-
42
-
43
-
44
-
45
-
46
-
47
-
48
-
49
-
50
-
 51
51 -
 52
52 -
 53
53 -
 54
54 -
 55
55 -
 56
56 -
 57
57 -
 58
58 -
 59
59 -
 60
60 -
 61
61 -
 62
62 -
 63
63 -
 64
64 -
 65
65 -
 66
66 -
 67
67 -
 68
68 -
 69
69 -
 70
70 -
 71
71 -
72
-
73
-
74
-
75
-
76
-
77
-
78
-
79
-
80
-
81
-
82
-
83
-
84
-
85
-
86
-
87
-
88
-
89
-
90
-
91
-
92
-
93
-
94
-
95
-
96
-
97
-
98
-
99
-
100
-
101
-
102
-
103
-
104
-
105
-
106
-
107
-
108
-
109
-
110
-
111
-
112
-
113
-
114
-
115
-
116
-
117
-
118
-
119
-
120
-
121
-
122
-
123
-
124
-
125
-
126
 |
 |

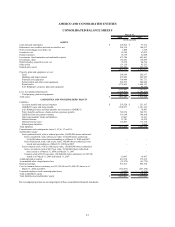
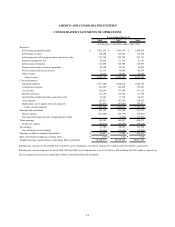
F-4
2008 2007 2006
Revenues:
Self-moving equipment rentals $ 1,451,292 $ 1,462,470 $ 1,489,429
Self-storage revenues 122,248 126,424 119,742
Self-moving and self-storage products and service sales 217,798 224,722 223,721
Property management fees 22,820 21,154 21,195
Life insurance premiums 111,996 120,399 118,833
Property and casualty insurance premiums 28,388 24,335 26,001
Net investment and interest income 62,110 59,696 48,279
Other revenue 32,522 30,098 40,325
Total revenues 2,049,174 2,069,298 2,087,525
Costs and expenses:
Operating expe
Commission ex
Cost of sales
Benefits and lo
Amortization o
Lease expense
Depreciation, ne
Total costs
Earnings from op
Interest expens
Fees and amor
Pretax earnings
Income tax ex
Net earnings
Less: Preferred s
Earnings availabl
Basic and dilute
Weighted average
Years Ended March 31,
(In thousands, except share and per share data)
Related party revenues for fiscal 2008, 2007 and 2006, net of eliminations, were $42.5 million, $33.5 million and $32.6 million, respectively.
The accompanying notes are an integral part of these consolidated financial statements.
Related party costs and expenses for fiscal 2008, 2007 and 2006, net of eliminations, were $31.8 million, $28.0 million and $29.2 million, respectively.
nses 1,077,108 1,080,412 1,082,158
penses 167,945 162,899 165,961
120,210 117,648 113,135
sses 111,195 118,725 117,160
f deferred policy acquisition costs 13,181 17,138 24,261
133,931 147,659 136,652
t of (gains) losses on disposals 221,882 189,589 142,817
and expenses 1,845,452 1,834,070 1,782,144
erations 203,722 235,228 305,381
e (101,420) (82,436) (69,481)
tization on early extinguishment of debt - (6,969) (35,627)
102,302 145,823 200,273
pense (34,518) (55,270) (79,119)
67,784 90,553 121,154
tock dividends (12,963) (12,963) (12,963)
e to common shareholders $ 54,821 $ 77,590 $ 108,191
d earnings per common share $ 2.78 $ 3.72 $ 5.19
common shares outstanding: Basic and diluted 19,740,571 20,838,570 20,857,108
CONSOLIDATED STATEMENTS OF OPERATIONS
AMERCO AND CONSOLIDATED ENTITIES