U-Haul 2008 Annual Report Download - page 28
Download and view the complete annual report
Please find page 28 of the 2008 U-Haul annual report below. You can navigate through the pages in the report by either clicking on the pages listed below, or by using the keyword search tool below to find specific information within the annual report.-
 1
1 -
2
-
3
-
4
-
5
-
6
-
7
-
8
-
9
-
10
-
11
-
12
-
13
-
14
-
15
-
16
-
17
-
 18
18 -
 19
19 -
 20
20 -
 21
21 -
 22
22 -
 23
23 -
 24
24 -
 25
25 -
 26
26 -
 27
27 -
 28
28 -
 29
29 -
 30
30 -
 31
31 -
 32
32 -
 33
33 -
 34
34 -
 35
35 -
 36
36 -
 37
37 -
 38
38 -
39
-
40
-
41
-
42
-
43
-
44
-
45
-
46
-
47
-
48
-
49
-
50
-
51
-
52
-
53
-
54
-
55
-
56
-
57
-
58
-
59
-
60
-
61
-
62
-
63
-
64
-
65
-
66
-
67
-
68
-
69
-
70
-
71
-
72
-
73
-
74
-
75
-
76
-
77
-
78
-
79
-
80
-
81
-
82
-
83
-
84
-
85
-
86
-
87
-
88
-
89
-
90
-
91
-
92
-
93
-
94
-
95
-
96
-
97
-
98
-
99
-
100
-
101
-
102
-
103
-
104
-
105
-
106
-
107
-
108
-
109
-
110
-
111
-
112
-
113
-
114
-
115
-
116
-
117
-
118
-
119
-
120
-
121
-
122
-
123
-
124
-
125
-
126
 |
 |

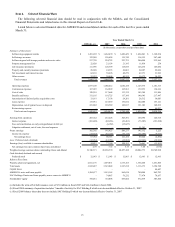
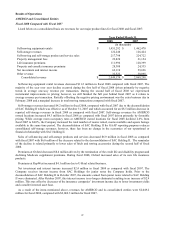
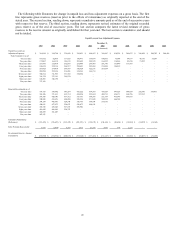
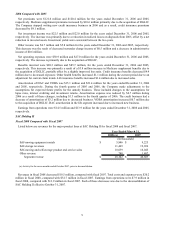
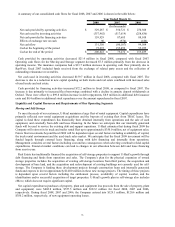
Listed below are revenues and earnings from operations at each of our four operating segments for fiscal 2008 and
fiscal 2007, the insurance companies years ended are December 31, 2007 and 2006.
2008 2007
Moving and storage
Revenues $ 1,858,230 $ 1,861,751
Earnings from operations 192,970 217,937
Property and casualty insurance
Revenues 40,478 38,486
Earnings from operations 9,244 5,741
Life insurance
Revenues 137,448 148,820
Earnings from operations 17,202 14,521
SAC Holding II (a)
Revenues 28,102 46,603
Earnings from operations 7,926 13,854
Eliminations
Revenues (15,084) (26,362)
Earnings from operations (23,620) (16,825)
Consolidated Results
Revenues 2,049,174 2,069,298
Earnings from operations 203,722 235,228
(a) Fiscal 2008 includes 7 months of activity for SAC Holding II which was deconsolidated effective October 31, 2007.
(In thousands)
Year Ended March 31,
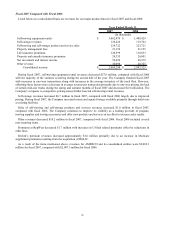
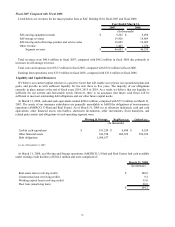
Total costs and expenses increased $11.4 million in fiscal 2008 as compared with fiscal 2007. The largest increase
was in depreciation expense associated with the rotation of our fleet. Conversely, with the shift in focus from
operating leases to purchases of new rental trucks, lease expense decreased in fiscal 2008 as compared with fiscal
2007. The Company nets gains and losses from the disposal of property and equipment against depreciation.
Included in depreciation are gains on the sale of real estate of $12.7 million and $4.4 million in fiscal 2008 and fiscal
2007, respectively. Repair and maintenance costs included in operating expenses declined for the year due to the
rotation of older trucks out of the active rental fleet. Benefits and operating expenses decreased at each of the
insurance companies as business volumes decline. Other operating costs including personnel, property tax and
certain legal-related expenses increased in fiscal 2008 as compared with fiscal 2007.
As a result of the aforementioned changes in revenues and expenses, earnings from operations decreased to
$203.7 million for fiscal 2008, compared with $235.2 million for fiscal 2007.
Interest expense for fiscal 2008 was $101.4 million, compared with $89.4 million in fiscal 2007. Fiscal 2007
results included a one-time, non-recurring charge of $7.0 million, before taxes, of deferred debt issuance costs
related to a loan that was amended. The refinancing costs had the effect of decreasing on a non-recurring basis,
earnings for the year ended March 31, 2007 by $0.33 per share before taxes, in which the tax effect was
approximately $0.13 per share. Absent this charge, the increase in interest expense in fiscal 2008 is related to
increased debt associated with the fleet rotation.
Income tax expense was $34.5 million in fiscal 2008, compared with $55.3 million in fiscal 2007.
Dividends accrued on our Series A preferred stock were $13.0 million in both fiscal 2008 and 2007, respectively.
As a result of the above mentioned items, net earnings available to common shareholders were $54.8 million in
fiscal 2008, compared with $77.6 million in fiscal 2007.
The weighted average common shares outstanding: basic and diluted were 19,740,571 in fiscal 2008 and
20,838,570 in fiscal 2007.
Basic and diluted earnings per share in fiscal 2008 were $2.78, compared with $3.72 in fiscal 2007.
23