Texas Instruments 2012 Annual Report Download - page 8
Download and view the complete annual report
Please find page 8 of the 2012 Texas Instruments annual report below. You can navigate through the pages in the report by either clicking on the pages listed below, or by using the keyword search tool below to find specific information within the annual report.-
 1
1 -
 2
2 -
 3
3 -
 4
4 -
 5
5 -
 6
6 -
 7
7 -
 8
8 -
 9
9 -
 10
10 -
 11
11 -
 12
12 -
 13
13 -
 14
14 -
 15
15 -
 16
16 -
 17
17 -
 18
18 -
 19
19 -
20
-
21
-
22
-
23
-
24
-
25
-
26
-
27
-
28
-
29
-
30
-
31
-
32
-
33
-
34
-
35
-
36
-
37
-
38
-
39
-
40
-
41
-
42
-
43
-
44
-
45
-
46
-
47
-
48
-
49
-
50
-
51
-
52
-
53
-
54
-
55
-
56
-
57
-
58
 |
 |

TEXAS INSTRUMENTS6 • 2012 ANNUAL REPORT
ANNUAL
REPORT
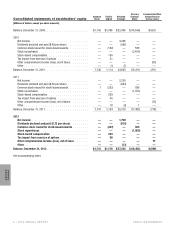
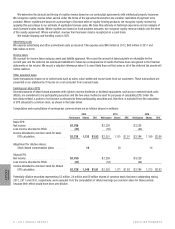
Consolidated statements of stockholders’ equity Common
Stock Paid-in
Capital Retained
Earnings
Treasury
Common
Stock
Accumulated Other
Comprehensive
Income (Loss)
[Millions of dollars, except per-share amounts]
Balance, December 31, 2009 . . . . . . . . . . . . . . . . . . . . . $1,740 $1,086 $ 22,066 $(14,549) $ (621)
2010
Net income . . . . . . . . . . . . . . . . . . . . . . . . . . . . — — 3,228 — —
Dividends declared and paid ($.49 per share) . . . . . . . . . . — — (592) — —
Common stock issued for stock-based awards . . . . . . . . . . — (182) — 588 —
Stock repurchases . . . . . . . . . . . . . . . . . . . . . . . . — — — (2,450) —
Stock-based compensation. . . . . . . . . . . . . . . . . . . . — 190 — — —
Tax impact from exercise of options . . . . . . . . . . . . . . . — 21 — — —
Other comprehensive income (loss), net of taxes . . . . . . . . . — — — — (80)
Other . . . . . . . . . . . . . . . . . . . . . . . . . . . . . . . — (1) (7) — —
Balance, December 31, 2010 . . . . . . . . . . . . . . . . . . . . . 1,740 1,114 24,695 (16,411) (701)
2011
Net income . . . . . . . . . . . . . . . . . . . . . . . . . . . . — — 2,236 — —
Dividends declared and paid ($.56 per share) . . . . . . . . . . — — (644) — —
Common stock issued for stock-based awards . . . . . . . . . . 1 (252) — 898 —
Stock repurchases . . . . . . . . . . . . . . . . . . . . . . . . — — — (1,973) —
Stock-based compensation. . . . . . . . . . . . . . . . . . . . — 269 — — —
Tax impact from exercise of options . . . . . . . . . . . . . . . — 45 — — —
Other comprehensive income (loss), net of taxes . . . . . . . . . — — — — (75)
Other . . . . . . . . . . . . . . . . . . . . . . . . . . . . . . . — 18 (9) 1 —
Balance, December 31, 2011 . . . . . . . . . . . . . . . . . . . . . 1,741 1,194 26,278 (17,485) (776)
2012
Net income . . . . . . . . . . . . . . . . . . . . . . . . . . . — — 1,759 — —
Dividends declared and paid ($.72 per share) . . . . . . . . . — — (819) — —
Common stock issued for stock-based awards . . . . . . . . — (337) — 823 —
Stock repurchases . . . . . . . . . . . . . . . . . . . . . . . — — — (1,800) —
Stock-based compensation . . . . . . . . . . . . . . . . . . — 263 — — —
Tax impact from exercise of options . . . . . . . . . . . . . . — 56 — — —
Other comprehensive income (loss), net of taxes . . . . . . . — — — — 77
Other . . . . . . . . . . . . . . . . . . . . . . . . . . . . . . . — — (13) — —
Balance, December 31, 2012 . . . . . . . . . . . . . . . . . . . . $1,741 $1,176 $27,205 $(18,462) $(699)
See accompanying notes.