Texas Instruments 2012 Annual Report Download - page 19
Download and view the complete annual report
Please find page 19 of the 2012 Texas Instruments annual report below. You can navigate through the pages in the report by either clicking on the pages listed below, or by using the keyword search tool below to find specific information within the annual report.
ANNUAL
REPORT
TEXAS INSTRUMENTS 2012 ANNUAL REPORT • 17
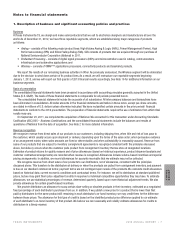
6. Profit sharing plans
Profit sharing benefits are generally formulaic and determined by one or more subsidiary or company-wide financial metrics. We pay
profit sharing benefits primarily under the company-wide TI Employee Profit Sharing Plan. This plan provides for profit sharing to be paid
based solely on TI’s operating margin for the full calendar year. Under this plan, TI must achieve a minimum threshold of 10 percent
operating margin before any profit sharing is paid. At 10 percent operating margin, profit sharing will be 2 percent of eligible payroll. The
maximum amount of profit sharing available under the plan is 20 percent of eligible payroll, which is paid only if TI’s operating margin is
at or above 35 percent for a full calendar year.
We recognized $96 million, $143 million and $279 million of profit sharing expense under the TI Employee Profit Sharing Plan in
2012, 2011 and 2010, respectively.
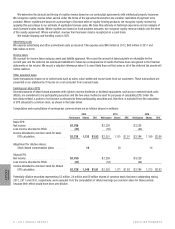
7. Income taxes
Income before income taxes U.S. Non-U.S. Total
2012 . . . . . . . . . . . . . . . . . . . . . . . . . . . . . . . . . . . . . . . . . . . . . . . . . . $ 319 $1,616 $ 1,935
2011 . . . . . . . . . . . . . . . . . . . . . . . . . . . . . . . . . . . . . . . . . . . . . . . . . . 1,791 1,164 2,955
2010 . . . . . . . . . . . . . . . . . . . . . . . . . . . . . . . . . . . . . . . . . . . . . . . . . . 3,769 782 4,551
Provision (benefit) for income taxes U.S. Federal Non-U.S. U.S. State Total
2012:
Current . . . . . . . . . . . . . . . . . . . . . . . . . . . . . . . . . . . . . . . . . $ (43) $ 156 $ (2) $ 111
Deferred . . . . . . . . . . . . . . . . . . . . . . . . . . . . . . . . . . . . . . . . . — 65 — 65
Total . . . . . . . . . . . . . . . . . . . . . . . . . . . . . . . . . . . . . . . . . . . . . $ (43) $ 221 $ (2) $ 176
2011:
Current . . . . . . . . . . . . . . . . . . . . . . . . . . . . . . . . . . . . . . . . . . $ 692 $ 138 $ 8 $ 838
Deferred . . . . . . . . . . . . . . . . . . . . . . . . . . . . . . . . . . . . . . . . . (154) 24 11 (119)
Total . . . . . . . . . . . . . . . . . . . . . . . . . . . . . . . . . . . . . . . . . . . . . $ 538 $ 162 $ 19 $ 719
2010:
Current . . . . . . . . . . . . . . . . . . . . . . . . . . . . . . . . . . . . . . . . . . $1,401 $ 92 $ 18 $ 1,511
Deferred . . . . . . . . . . . . . . . . . . . . . . . . . . . . . . . . . . . . . . . . . (188) (2) 2 (188)
Total . . . . . . . . . . . . . . . . . . . . . . . . . . . . . . . . . . . . . . . . . . . . . $1,213 $ 90 $ 20 $ 1,323
Principal reconciling items from income tax computed at the statutory federal rate follow:
2012 2011 2010
Computed tax at statutory rate . . . . . . . . . . . . . . . . . . . . . . . . . . . . . . . . . . . . . $ 677 $1,034 $1,593
Non-U.S. effective tax rates . . . . . . . . . . . . . . . . . . . . . . . . . . . . . . . . . . . . . . (345) (245) (184)
U.S. tax benefit for manufacturing . . . . . . . . . . . . . . . . . . . . . . . . . . . . . . . . . . . (158) (31) (63)
Impact of changes to uncertain tax positions . . . . . . . . . . . . . . . . . . . . . . . . . . . . . . (88) — —
Non-deductible expenses. . . . . . . . . . . . . . . . . . . . . . . . . . . . . . . . . . . . . . . . 42 27 10
U.S. R&D tax credit . . . . . . . . . . . . . . . . . . . . . . . . . . . . . . . . . . . . . . . . . . . —(58) (54)
Other . . . . . . . . . . . . . . . . . . . . . . . . . . . . . . . . . . . . . . . . . . . . . . . . . . 48 (8 ) 21
Total provision for income taxes . . . . . . . . . . . . . . . . . . . . . . . . . . . . . . . . . . . . $ 176 $ 719 $1,323
The total provision for 2012 in the reconciliation above includes $252 million of discrete tax benefits primarily for additional U.S. tax
benefits for manufacturing related to the years 2000 through 2011.


