Texas Instruments 2012 Annual Report Download - page 4
Download and view the complete annual report
Please find page 4 of the 2012 Texas Instruments annual report below. You can navigate through the pages in the report by either clicking on the pages listed below, or by using the keyword search tool below to find specific information within the annual report.-
 1
1 -
 2
2 -
 3
3 -
 4
4 -
 5
5 -
 6
6 -
 7
7 -
 8
8 -
 9
9 -
 10
10 -
 11
11 -
 12
12 -
 13
13 -
 14
14 -
 15
15 -
16
-
17
-
18
-
19
-
20
-
21
-
22
-
23
-
24
-
25
-
26
-
27
-
28
-
29
-
30
-
31
-
32
-
33
-
34
-
35
-
36
-
37
-
38
-
39
-
40
-
41
-
42
-
43
-
44
-
45
-
46
-
47
-
48
-
49
-
50
-
51
-
52
-
53
-
54
-
55
-
56
-
57
-
58
 |
 |

TEXAS INSTRUMENTS2 • 2012 ANNUAL REPORT
ANNUAL
REPORT
For Years Ended
December 31,
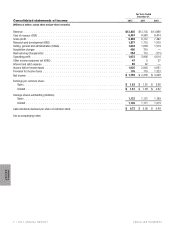
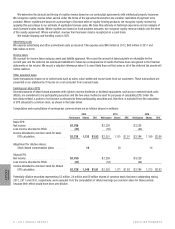
Consolidated statements of income 2012 2011 2010
[Millions of dollars, except share and per-share amounts]
Revenue . . . . . . . . . . . . . . . . . . . . . . . . . . . . . . . . . . . . . . . . . . . . . . . $12,825 $13,735 $13,966
Cost of revenue (COR) . . . . . . . . . . . . . . . . . . . . . . . . . . . . . . . . . . . . . . . . 6,457 6,963 6,474
Gross profit . . . . . . . . . . . . . . . . . . . . . . . . . . . . . . . . . . . . . . . . . . . . . . 6,368 6,772 7,492
Research and development (R&D) . . . . . . . . . . . . . . . . . . . . . . . . . . . . . . . . . . 1,877 1,715 1,570
Selling, general and administrative (SG&A) . . . . . . . . . . . . . . . . . . . . . . . . . . . . . . 1,804 1,638 1,519
Acquisition charges . . . . . . . . . . . . . . . . . . . . . . . . . . . . . . . . . . . . . . . . . 450 315 —
Restructuring charges/other . . . . . . . . . . . . . . . . . . . . . . . . . . . . . . . . . . . . . 264 112 (111)
Operating profit. . . . . . . . . . . . . . . . . . . . . . . . . . . . . . . . . . . . . . . . . . . . 1,973 2,992 4,514
Other income (expense) net (OI&E) . . . . . . . . . . . . . . . . . . . . . . . . . . . . . . . . . . 47 5 37
Interest and debt expense . . . . . . . . . . . . . . . . . . . . . . . . . . . . . . . . . . . . . . 85 42 —
Income before income taxes . . . . . . . . . . . . . . . . . . . . . . . . . . . . . . . . . . . . . 1,935 2,955 4,551
Provision for income taxes . . . . . . . . . . . . . . . . . . . . . . . . . . . . . . . . . . . . . . 176 719 1,323
Net income . . . . . . . . . . . . . . . . . . . . . . . . . . . . . . . . . . . . . . . . . . . . . . $ 1,759 $ 2,236 $ 3,228
Earnings per common share:
Basic . . . . . . . . . . . . . . . . . . . . . . . . . . . . . . . . . . . . . . . . . . . . . . . $ 1.53 $ 1.91 $ 2.66
Diluted . . . . . . . . . . . . . . . . . . . . . . . . . . . . . . . . . . . . . . . . . . . . . . $ 1.51 $ 1.88 $ 2.62
Average shares outstanding (millions):
Basic . . . . . . . . . . . . . . . . . . . . . . . . . . . . . . . . . . . . . . . . . . . . . . . 1,132 1,151 1,199
Diluted . . . . . . . . . . . . . . . . . . . . . . . . . . . . . . . . . . . . . . . . . . . . . . 1,146 1,171 1,213
Cash dividends declared per share of common stock . . . . . . . . . . . . . . . . . . . . . . . . . $ 0.72 $ 0.56 $ 0.49
See accompanying notes.