Texas Instruments 2012 Annual Report Download - page 20
Download and view the complete annual report
Please find page 20 of the 2012 Texas Instruments annual report below. You can navigate through the pages in the report by either clicking on the pages listed below, or by using the keyword search tool below to find specific information within the annual report.-
 1
1 -
2
-
3
-
4
-
5
-
6
-
7
-
8
-
9
-
 10
10 -
 11
11 -
 12
12 -
 13
13 -
 14
14 -
 15
15 -
 16
16 -
 17
17 -
 18
18 -
 19
19 -
 20
20 -
 21
21 -
 22
22 -
 23
23 -
 24
24 -
 25
25 -
 26
26 -
 27
27 -
 28
28 -
 29
29 -
 30
30 -
31
-
32
-
33
-
34
-
35
-
36
-
37
-
38
-
39
-
40
-
41
-
42
-
43
-
44
-
45
-
46
-
47
-
48
-
49
-
50
-
51
-
52
-
53
-
54
-
55
-
56
-
57
-
58
 |
 |

ANNUAL
REPORT
TEXAS INSTRUMENTS18 • 2012 ANNUAL REPORT
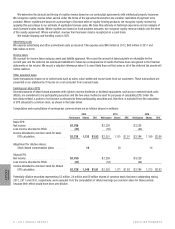
The primary components of deferred income tax assets and liabilities were as follows:
December 31,
2012 2011
Deferred income tax assets:
Inventories and related reserves . . . . . . . . . . . . . . . . . . . . . . . . . . . . . . . . . . . . . . $ 734 $ 913
Deferred loss and tax credit carryforwards . . . . . . . . . . . . . . . . . . . . . . . . . . . . . . . . . 382 400
Stock-based compensation. . . . . . . . . . . . . . . . . . . . . . . . . . . . . . . . . . . . . . . . . 366 357
Postretirement benefit costs recognized in AOCI . . . . . . . . . . . . . . . . . . . . . . . . . . . . . . 357 431
Accrued expenses . . . . . . . . . . . . . . . . . . . . . . . . . . . . . . . . . . . . . . . . . . . . . 331 322
Other . . . . . . . . . . . . . . . . . . . . . . . . . . . . . . . . . . . . . . . . . . . . . . . . . . . . 209 122
2,379 2,545
Less valuation allowance . . . . . . . . . . . . . . . . . . . . . . . . . . . . . . . . . . . . . . . . . . (221) (178)
2,158 2,367
Deferred income tax liabilities:
Acquisition-related intangibles and fair-value adjustments . . . . . . . . . . . . . . . . . . . . . . . . . (921) (1,030)
Accrued retirement costs (defined benefit and retiree health care) . . . . . . . . . . . . . . . . . . . . . (243) (180)
Property, plant and equipment . . . . . . . . . . . . . . . . . . . . . . . . . . . . . . . . . . . . . . . (131) (141)
International earnings . . . . . . . . . . . . . . . . . . . . . . . . . . . . . . . . . . . . . . . . . . . (102) (92)
Other . . . . . . . . . . . . . . . . . . . . . . . . . . . . . . . . . . . . . . . . . . . . . . . . . . . . (11) (36)
(1,408) (1,479)
Net deferred income tax asset . . . . . . . . . . . . . . . . . . . . . . . . . . . . . . . . . . . . . . . . . $ 750 $ 888
The deferred income tax assets and liabilities based on tax jurisdictions are presented on the Consolidated balance sheets as follows:
December 31,
2012 2011
Current deferred income tax assets . . . . . . . . . . . . . . . . . . . . . . . . . . . . . . . . . . . . $ 1,044 $ 1,174
Noncurrent deferred income tax assets . . . . . . . . . . . . . . . . . . . . . . . . . . . . . . . . . . 280 321
Current deferred income tax liabilities . . . . . . . . . . . . . . . . . . . . . . . . . . . . . . . . . . . (2) —
Noncurrent deferred income tax liabilities . . . . . . . . . . . . . . . . . . . . . . . . . . . . . . . . . (572) (607)
Net deferred income tax asset . . . . . . . . . . . . . . . . . . . . . . . . . . . . . . . . . . . . . . . . . $ 750 $ 888
We make an ongoing assessment regarding the realization of U.S. and non-U.S. deferred tax assets. In 2012, we recognized a net
increase of $43 million in our valuation allowance. This increase was due to valuation allowances on unutilized tax credits. While the net
deferred tax assets of $2.16 billion at December 31, 2012, are not assured of realization, our assessment is that a valuation allowance
is not required on this balance. This assessment is based on our evaluation of relevant criteria including the existence of deferred
tax liabilities that can be used to absorb deferred tax assets, taxable income in prior carryback years and expectations for future
taxable income.
We have U.S. and non-U.S. tax loss carryforwards of approximately $175 million, none of which will expire before the year 2023.
A provision has been made for deferred taxes on undistributed earnings of non-U.S. subsidiaries to the extent that dividend
payments from these subsidiaries are expected to result in additional tax liability. The remaining undistributed earnings (approximately
$5.54 billion at December 31, 2012) have been indefinitely reinvested; therefore, no provision has been made for taxes due upon
remittance of these earnings. The indefinitely reinvested earnings of our non-U.S. subsidiaries are primarily invested in tangible assets
such as inventory and property, plant and equipment. Determination of the amount of unrecognized deferred income tax liability is not
practical because of the complexities associated with its hypothetical calculation.
Cash payments made for income taxes, net of refunds, were $171 million, $902 million and $1.47 billion for the years ended
December 31, 2012, 2011 and 2010, respectively.