Tesco 2005 Annual Report Download - page 66
Download and view the complete annual report
Please find page 66 of the 2005 Tesco annual report below. You can navigate through the pages in the report by either clicking on the pages listed below, or by using the keyword search tool below to find specific information within the annual report.-
 1
1 -
2
-
3
-
4
-
5
-
6
-
7
-
8
-
9
-
10
-
11
-
12
-
13
-
14
-
15
-
16
-
17
-
18
-
19
-
20
-
21
-
22
-
23
-
24
-
25
-
26
-
27
-
28
-
29
-
30
-
31
-
32
-
33
-
34
-
35
-
36
-
37
-
38
-
39
-
40
-
41
-
42
-
43
-
44
-
45
-
46
-
47
-
48
-
49
-
50
-
51
-
52
-
53
-
54
-
55
-
 56
56 -
 57
57 -
 58
58 -
 59
59 -
 60
60 -
 61
61 -
 62
62 -
 63
63 -
 64
64 -
 65
65 -
 66
66 -
 67
67 -
 68
68
 |
 |

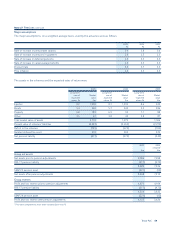
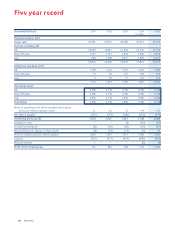
Five year record
Year ended February 2001 2002 2003 2004 2005
53 weeks
Financial statistics (£m)
Group sales 22,585 25,401 28,280 33,557 37,070
Turnover excluding VAT
UK 18,203 19,821 21,309 24,760 27,146
Rest of Europe 1,737 2,181 2,664 3,385 3,818
Asia 860 1,398 2,031 2,669 3,010
20,800 23,400 26,004 30,814 33,974
Underlying operating profit 1
UK 1,100 1,213 1,297 1,526 1,694
Rest of Europe 70 90 141 184 218
Asia 4 29 71 122 152
1,174 1,332 1,509 1,832 2,064
Operating margin 1
UK 6.0% 6.1% 6.1% 6.2% 6.2%
Rest of Europe 4.0% 4.1% 5.3% 5.4% 5.7%
Asia 0.5% 2.1% 3.5% 4.6% 5.0%
Total Group 5.6% 5.7% 5.8% 5.9% 6.1%
Share of operating profit before goodwill amortisation
from joint ventures and associates 21 42 72 99 135
Net interest payable (125) (153) (180) (223) (170)
Underlying pre-tax profit 21,070 1,221 1,401 1,708 2,029
Integration costs – – (4) (45) (53)
Goodwill amortisation (8) (10) (23) (54) (67)
Net profit/(loss) on disposal of fixed assets (8) (10) (13) (9) 53
Profit on ordinary activities before taxation 1,054 1,201 1,361 1,600 1,962
Taxation (333) (371) (415) (498) (593)
Minority interests 1 – – (2) (3)
Profit for the financial year 722 830 946 1,100 1,366
64 Tesco PLC