Tesco 2005 Annual Report Download - page 59
Download and view the complete annual report
Please find page 59 of the 2005 Tesco annual report below. You can navigate through the pages in the report by either clicking on the pages listed below, or by using the keyword search tool below to find specific information within the annual report.-
 1
1 -
2
-
3
-
4
-
5
-
6
-
7
-
8
-
9
-
10
-
11
-
12
-
13
-
14
-
15
-
16
-
17
-
18
-
19
-
20
-
21
-
22
-
23
-
24
-
25
-
26
-
27
-
28
-
29
-
30
-
31
-
32
-
33
-
34
-
35
-
36
-
37
-
38
-
39
-
40
-
41
-
42
-
43
-
44
-
45
-
46
-
47
-
48
-
 49
49 -
 50
50 -
 51
51 -
 52
52 -
 53
53 -
 54
54 -
 55
55 -
 56
56 -
 57
57 -
 58
58 -
 59
59 -
 60
60 -
 61
61 -
 62
62 -
 63
63 -
 64
64 -
 65
65 -
 66
66 -
 67
67 -
 68
68
 |
 |

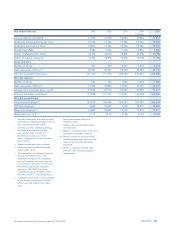
Tesco PLC 57
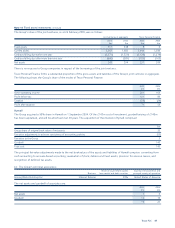
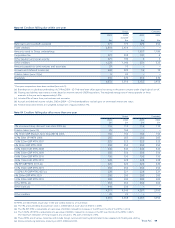
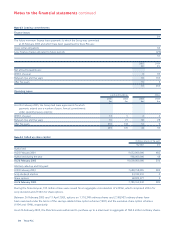
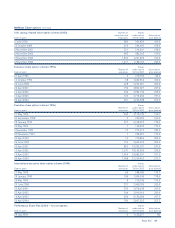
NOTE 26 Share options continued
Irish savings-related share option scheme (2000) Number of Shares
executives and under option Subscription
Date of grant employees 26 Feb 2005 price (pence)
2 June 2000 689 963,830 163.0
26 October 2000 210 244,695 198.0
8 November 2001 331 314,241 198.0
8 November 2002 963 982,303 159.0
6 November 2003 1,353 1,201,870 195.0
4 November 2004 1,471 1,188,164 232.0
Executive share option scheme (1994) Shares
Number of under option Subscription
Date of grant executives 26 Feb 2005 price (pence)
27 April 1995 2 210,102 90.3
13 October 1995 38 1,049,355 104.0
26 June 2000 628 5,235,061 205.0
26 April 2001 790 4,825,927 247.0
15 April 2002 546 2,992,196 259.0
14 April 2003 725 3,713,204 197.5
30 April 2004 501 3,264,848 253.3
Executive share option scheme (1996) Shares
Number of under option Subscription
Date of grant executives 26 Feb 2005 price (pence)
21 May 1998 260 4,116,743 176.7
30 September 1998 9 229,950 164.0
28 January 1999 337 5,108,019 178.0
24 May 1999 1 120,220 179.4
9 November 1999 10 273,412 184.0
30 November 1999 1 228,901 173.0
20 April 2000 15 770,836 209.5
26 June 2000 155 3,642,552 205.0
26 April 2001 802 10,395,207 247.0
15 April 2002 1,241 18,163,450 259.0
14 April 2003 1,454 29,085,597 197.5
30 April 2004 1,608 25,560,455 253.3
International executive share option scheme (1994) Shares
Number of under option Subscription
Date of grant executives 26 Feb 2005 price (pence)
21 May 1998 60 588,000 176.7
28 January 1999 104 1,094,500 178.0
24 May 1999 8 310,746 179.4
26 June 2000 231 2,400,709 205.0
26 April 2001 393 2,678,298 247.0
25 April 2002 544 3,919,010 259.0
14 April 2003 624 6,136,604 197.5
30 April 2004 796 5,897,635 253.3
Performance Share Plan (2004) – nil cost options Shares
Number of under option Subscription
Date of grant executives 26 Feb 2005 price (pence)
28 July 2004 6 1,126,257 Nil