Tesco 2005 Annual Report Download - page 43
Download and view the complete annual report
Please find page 43 of the 2005 Tesco annual report below. You can navigate through the pages in the report by either clicking on the pages listed below, or by using the keyword search tool below to find specific information within the annual report.-
 1
1 -
2
-
3
-
4
-
5
-
6
-
7
-
8
-
9
-
10
-
11
-
12
-
13
-
14
-
15
-
16
-
17
-
18
-
19
-
20
-
21
-
22
-
23
-
24
-
25
-
26
-
27
-
28
-
29
-
30
-
31
-
32
-
 33
33 -
 34
34 -
 35
35 -
 36
36 -
 37
37 -
 38
38 -
 39
39 -
 40
40 -
 41
41 -
 42
42 -
 43
43 -
 44
44 -
 45
45 -
 46
46 -
 47
47 -
 48
48 -
 49
49 -
 50
50 -
 51
51 -
 52
52 -
 53
53 -
54
-
55
-
56
-
57
-
58
-
59
-
60
-
61
-
62
-
63
-
64
-
65
-
66
-
67
-
68
 |
 |

Tesco PLC 41
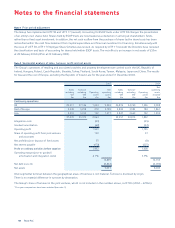
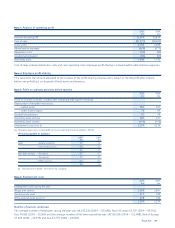
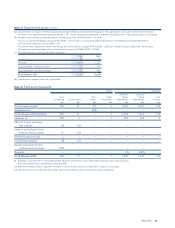
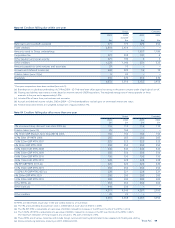
Note 3 Analysis of operating profit
2005 2004
£m £m
Turnover excluding VAT 33,974 30,814
Cost of sales (31,271) (28,405)
Gross profit 2,703 2,409
Administrative expenses (639) (577)
Integration costs (53) (45)
Goodwill amortisation (62) (52)
Operating profit 1,949 1,735
Cost of sales includes distribution costs and store operating costs. Employee profit-sharing is included within administrative expenses.
Note 4 Employee profit-sharing
This represents the amount allocated to the trustees of the profit-sharing scheme and is based on the UK profit after interest,
before net profit/(loss) on disposal of fixed assets and taxation.
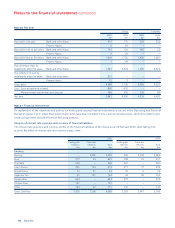
Note 5 Profit on ordinary activities before taxation
2005 2004
£m £m
Profit on ordinary activities is stated after charging/(crediting) the following:
Depreciation of tangible fixed assets:
– owned assets 654 631
– under finance leases 79 69
Goodwill amortisation 67 54
Operating lease costs (a) 283 221
Operating lease income (119) (102)
Employment costs (note 6) 3,534 3,234
(a) Operating lease costs include £68m for hire of plant and machinery (2004 – £55m).
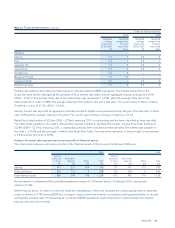
Amounts payable to auditors:
2005 2004
£m £m
Audit – statutory audit (i) 1.7 1.2
– other audit services 0.4 0.3
2.1 1.5
Non-audit services – Assurance 0.7 0.7
– Tax services 1.1 0.5
– Other services 0.2 0.1
2.0 1.3
(i) Includes £0.1m (2004 – £0.1m) for the company.
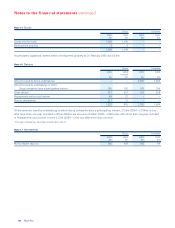
Note 6 Employment costs
2005 2004
£m £m
Employment costs during the year
Wages and salaries 3,089 2,891
Social security costs 217 183
Other pension costs (note 27) 228 160
3,534 3,234
Number of persons employed
The average number of employees during the year was: UK 245,286 (2004 – 230,680), Rest of Europe 55,781 (2004 – 49,362),
Asia 34,683 (2004 – 30,369) and the average number of full-time equivalents was: UK 163,006 (2004 – 152,408), Rest of Europe
47,204 (2004 – 42,399) and Asia 32,770 (2004 – 28,528).