Tesco 2005 Annual Report Download - page 61
Download and view the complete annual report
Please find page 61 of the 2005 Tesco annual report below. You can navigate through the pages in the report by either clicking on the pages listed below, or by using the keyword search tool below to find specific information within the annual report.-
 1
1 -
2
-
3
-
4
-
5
-
6
-
7
-
8
-
9
-
10
-
11
-
12
-
13
-
14
-
15
-
16
-
17
-
18
-
19
-
20
-
21
-
22
-
23
-
24
-
25
-
26
-
27
-
28
-
29
-
30
-
31
-
32
-
33
-
34
-
35
-
36
-
37
-
38
-
39
-
40
-
41
-
42
-
43
-
44
-
45
-
46
-
47
-
48
-
49
-
50
-
 51
51 -
 52
52 -
 53
53 -
 54
54 -
 55
55 -
 56
56 -
 57
57 -
 58
58 -
 59
59 -
 60
60 -
 61
61 -
 62
62 -
 63
63 -
 64
64 -
 65
65 -
 66
66 -
 67
67 -
 68
68
 |
 |

Tesco PLC 59
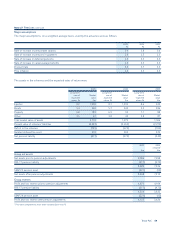
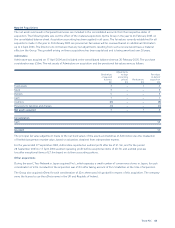
Note 27 Pensions continued
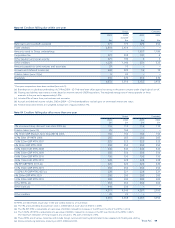
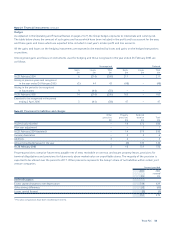
Major assumptions
The major assumptions, on a weighted average basis, used by the actuaries were as follows:
2005 2004 2003
%%%
Rate of increase in pensionable salaries 3.9 3.8 3.6
Rate of increase in pensions in payment 2.6 2.5 2.3
Rate of increase in deferred pensions 2.6 2.5 2.3
Rate of increase in career average benefits 2.6 2.5 2.3
Discount rate 5.4 5.7 5.5
Price inflation 2.6 2.5 2.3
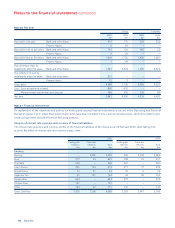
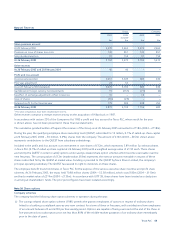
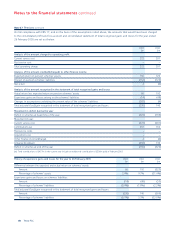
The assets in the schemes and the expected rates of return were:
2005 2004 2003
Long-term Long-term Long-term
rate of Market rate of Market rate of Market
expected value expected value expected value
return % £m return % £m return % £m
Equities 8.2 1,908 8.1 1,399 8.6 945
Bonds 5.4 560 5.7 445 5.5 386
Property 6.8 183 6.9 92 7.1 88
Other 3.5 67 3.8 43 3.8 87
Total market value of assets 2,718 1,979 1,506
Present value of schemes’ liabilities (3,453) (2,653) (2,275)
Deficit in the schemes (735) (674) (769)
Related deferred tax asset 218 202 229
Net pension liability (517) (472) (540)
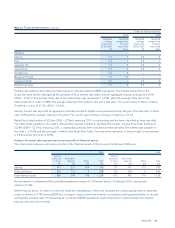
2005 2004
restated†
£m £m
Group net assets
Net assets prior to pension adjustments 9,006 7,998
FRS 17 pension liability (517) (472)
8,489 7,526
SSAP 24 pension asset (221) (12)
Net assets after pension adjustments 8,268 7,514
Group reserves
Profit and loss reserve prior to pension adjustments 4,873 4,104
FRS 17 pension liability (517) (472)
4,356 3,632
SSAP 24 pension asset (221) (12)
Profit and loss reserve after pension adjustments 4,135 3,620
†Prior year comparatives have been restated (see note 1).