Tesco 2005 Annual Report Download - page 42
Download and view the complete annual report
Please find page 42 of the 2005 Tesco annual report below. You can navigate through the pages in the report by either clicking on the pages listed below, or by using the keyword search tool below to find specific information within the annual report.-
 1
1 -
2
-
3
-
4
-
5
-
6
-
7
-
8
-
9
-
10
-
11
-
12
-
13
-
14
-
15
-
16
-
17
-
18
-
19
-
20
-
21
-
22
-
23
-
24
-
25
-
26
-
27
-
28
-
29
-
30
-
31
-
 32
32 -
 33
33 -
 34
34 -
 35
35 -
 36
36 -
 37
37 -
 38
38 -
 39
39 -
 40
40 -
 41
41 -
 42
42 -
 43
43 -
 44
44 -
 45
45 -
 46
46 -
 47
47 -
 48
48 -
 49
49 -
 50
50 -
 51
51 -
 52
52 -
53
-
54
-
55
-
56
-
57
-
58
-
59
-
60
-
61
-
62
-
63
-
64
-
65
-
66
-
67
-
68
 |
 |

40 Tesco PLC
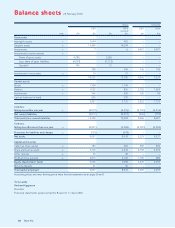
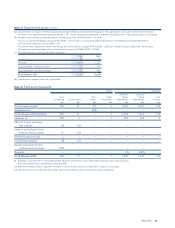
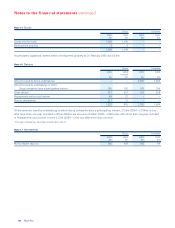
Note 1 Prior period adjustment
The Group has implemented UITF 38 and UITF 17 (revised). Accounting for ESOP trusts under UITF 38 changes the presentation
of an entity’s own shares held. Shares held by ESOP trusts are now treated as a deduction in arriving at shareholders’ funds,
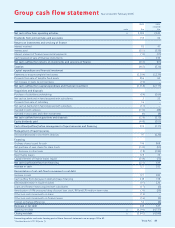
rather than a fixed asset investment. In addition, the net cash outflow from the purchase of shares by the share trusts has been
reclassified within the cash flow statement from Capital expenditure and financial investment to Financing. Simultaneously with
the issue of UITF 38, UITF 17 Employee Share Schemes was revised. As required by UITF 17 (revised) the Directors have reviewed
the classification and basis of accounting for shares held within ESOP trusts. The net effect is an increase in net assets of £53m
at 28 February 2004 (£25m at 22 February 2003).
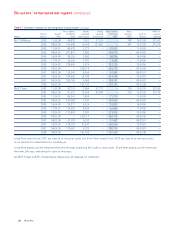
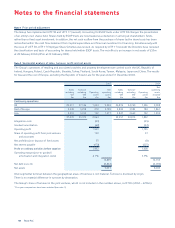
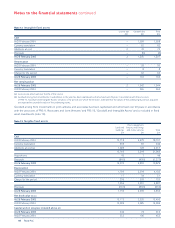
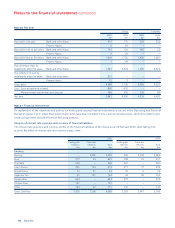
Note 2 Segmental analysis of sales, turnover, profit and net assets
The Group’s operations of retailing and associated activities and property development are carried out in the UK, Republic of
Ireland, Hungary, Poland, Czech Republic, Slovakia, Turkey, Thailand, South Korea, Taiwan, Malaysia, Japan and China. The results
for Asia and the rest of Europe, excluding the Republic of Ireland, are for the year ended 31 December 2004.
2005 2004
Net
Sales Turnover Net Sales Turnover operating
including excluding Operating operating including excluding Operating assets
VAT VAT profit assets VAT VAT profit restated†
£m £m £m £m £m £m £m £m
Continuing operations
UK 29,511 27,146 1,694 9,243 26,876 24,760 1,526 9,038
Rest of Europe 4,349 3,818 218 2,139 3,834 3,385 184 1,861
Asia 3,210 3,010 152 1,517 2,847 2,669 122 1,234
37,070 33,974 2,064 33,557 30,814 1,832
Integration costs (53) (45)
Goodwill amortisation (62) (52)
Operating profit 1,949 1,735
Share of operating profit from joint ventures 130 97
and associates
Net profit/(loss) on disposal of fixed assets 53 (9)
Net interest payable (170) (223)
Profit on ordinary activities before taxation 1,962 1,600
Operating margin (prior to goodwill
amortisation and integration costs) 6.1% 5.9%
12,899 12,133
Net debt (note 20) (3,842) (4,090)
Net assets 9,057 8,043
Inter-segmental turnover between the geographical areas of business is not material. Turnover is disclosed by origin.
There is no material difference in turnover by destination.
The Group’s share of turnover in the joint ventures, which is not included in the numbers above, is £379m (2004 – £236m).
†Prior year comparatives have been restated (see note 1).
Notes to the financial statements