Tesco 2003 Annual Report Download - page 57
Download and view the complete annual report
Please find page 57 of the 2003 Tesco annual report below. You can navigate through the pages in the report by either clicking on the pages listed below, or by using the keyword search tool below to find specific information within the annual report.-
 1
1 -
2
-
3
-
4
-
5
-
6
-
7
-
8
-
9
-
10
-
11
-
12
-
13
-
14
-
15
-
16
-
17
-
18
-
19
-
20
-
21
-
22
-
23
-
24
-
25
-
26
-
27
-
28
-
29
-
30
-
31
-
32
-
33
-
34
-
35
-
36
-
37
-
38
-
39
-
40
-
41
-
42
-
43
-
44
-
45
-
46
-
 47
47 -
 48
48 -
 49
49 -
 50
50 -
 51
51 -
 52
52 -
 53
53 -
 54
54 -
 55
55 -
 56
56 -
 57
57 -
 58
58 -
 59
59 -
 60
60
 |
 |

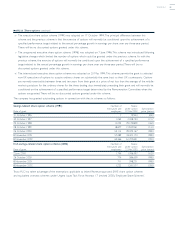
TESCO PLC 55
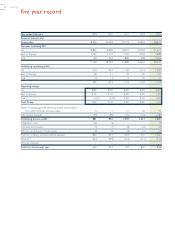
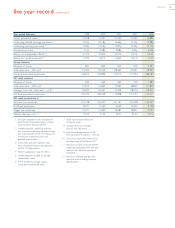
five year record continued
Year ended February 1999 2000 2001 2002 2003
Group enterprise value 413,528 13,591 21,590 21,290 16,896
Underlying diluted earnings per share 2/3 9.37p 10.18p 10.66p 12.14p 13.98p
Underlying earnings per share 2/3 9.59p 10.36p 10.87p 12.33p 14.10p
Dividend per share 4.12p 4.48p 4.98p 5.60p 6.20p
Return on shareholders’ funds 3/5 21.3% 20.9% 22.7% 23.2% 23.3%
Return on capital employed 3/6 17.2% 16.1% 16.6% 16.1% 15.3%
Group statistics
Number of stores 821 845 907 979 2,291
Total sales area – 000 sq ft 21,353 24,039 28,362 32,491 39,944
Full-time equivalent employees 126,914 134,896 152,210 171,794 188,182
UK retail statistics
Number of stores 639 659 692 729 1,982
Total sales area – 000 sq ft 715,975 16,895 17,965 18,822 21,829
Average store size (sales area – sq ft) 825,627 26,641 27,636 28,576 29,455
Full-time equivalent employees 9104,772 108,409 113,998 121,272 133,051
UK retail productivity £ 10
Turnover per employee 11 151,138 156,427 161,161 165,348 162,457
Profit per employee 11 8,771 9,160 9,649 10,002 9,748
Wages per employee 11 15,271 15,600 16,087 16,821 17,020
Weekly sales per sq ft 7/12 21.05 21.43 22.01 22.33 22.16
1 Excludes integration costs and goodwill
amortisation. Operating margin is based
upon turnover exclusive of VAT.
2 Underlying profit, underlying earnings
per share and underlying diluted earnings
per share exclude net loss on disposal of
fixed assets, integration costs and
goodwill amortisation.
3 2003, 2002 and 2001 statistics have
been calculated based on the adoption
of FRS 19 ‘Deferred Tax’.
4 Market capitalisation plus net debt.
5 Underlying profit divided by average
shareholders’ funds.
6 Profit divided by average capital
employed excluding net debt.
7 Store sizes exclude lobby and
restaurant areas.
8 Average store size excludes
Express and T&S stores.
9 Based on average number of full-
time equivalent employees in the UK.
10 2003 ratios have been impacted by
the acquisition of T&S Stores PLC.
11 Based on turnover exclusive of VAT,
underlying operating profit and total
staff cost per full-time equivalent
employee.
12 Based on weighted average sales
area and sales excluding property
development.