Tesco 2003 Annual Report Download - page 40
Download and view the complete annual report
Please find page 40 of the 2003 Tesco annual report below. You can navigate through the pages in the report by either clicking on the pages listed below, or by using the keyword search tool below to find specific information within the annual report.-
 1
1 -
2
-
3
-
4
-
5
-
6
-
7
-
8
-
9
-
10
-
11
-
12
-
13
-
14
-
15
-
16
-
17
-
18
-
19
-
20
-
21
-
22
-
23
-
24
-
25
-
26
-
27
-
28
-
29
-
 30
30 -
 31
31 -
 32
32 -
 33
33 -
 34
34 -
 35
35 -
 36
36 -
 37
37 -
 38
38 -
 39
39 -
 40
40 -
 41
41 -
 42
42 -
 43
43 -
 44
44 -
 45
45 -
 46
46 -
 47
47 -
 48
48 -
 49
49 -
 50
50 -
51
-
52
-
53
-
54
-
55
-
56
-
57
-
58
-
59
-
60
 |
 |

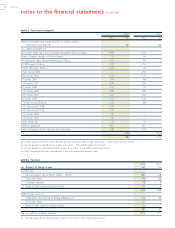
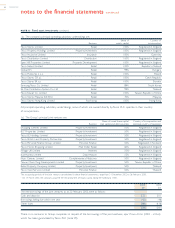
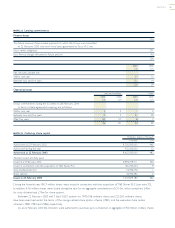
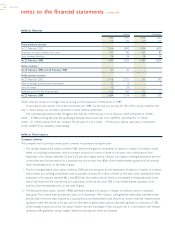
NOTE 17 Creditors falling due within one year
Group Company
2003 2002 2003 2002
£m £m £m £m
Bank loans and overdrafts (a) 1,286 1,474 1,162 1,890
Trade creditors 2,196 1,830 – –
Amounts owed to Group undertakings – – 351 2,455
Corporation tax 230 259 5 5
Other taxation and social security 170 52 – –
Other creditors 853 732 20 18
Accruals and deferred income (b) 263 164 105 56
Finance leases (note 22) 55 15 – –
Dividends 319 283 318 283
5,372 4,809 1,961 4,707
(a) Bank deposits in subsidiary undertakings of £299m (2002 – £1,636m) have been offset against borrowings in the parent company under a legal right
of set-off.
(b) A gain of £45m, realised in a prior year, on terminated interest rate swaps is being spread over the life of replacement swaps entered into at the same
time for similar periods. Accruals and deferred income includes £nil (2002 – £2m) attributable to these realised gains.
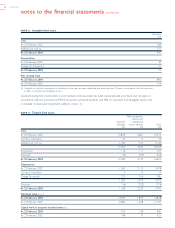
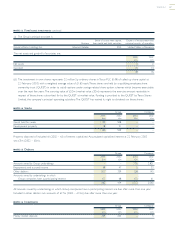
NOTE 18 Creditors falling due after more than one year
Group Company
2003 2002 2003 2002
£m £m £m £m
4% unsecured deep discount loan stock 2006 (a) 104 99 104 99
Finance leases (note 22) 171 14 – –
6% bonds 2006 (b) 150 150 150 150
0.7% 50bn Yen bonds 2006 (j) 285 285 285 285
71⁄2% bonds 2007 (c) 325 325 325 325
6% bonds 2008 (d) 250 250 250 250
51⁄4% 500m Euro bonds 2008 (j) 308 – 308 –
51⁄8% bonds 2009 (e) 350 350 350 350
65⁄8% bonds 2010 (f) 150 150 150 150
43⁄4% 750m Euro bonds 2010 (j) 477 – 477 –
4% RPI bonds 2016 (g) 212 210 212 210
51⁄2% bonds 2019 (j) 350 – 350 –
3.322% LPI bonds 2025 (h) 215 162 215 162
6% bonds 2029 (i) 200 200 200 200
51⁄2% bonds 2033 (j) 200 – 200 –
Other bonds (j) 197 191 196 191
Other loans (k) 90 355 – 237
4,034 2,741 3,772 2,609
Other creditors 15–––
4,049 2,741 3,772 2,609
38 TESCO PLC
notes to the financial statements continued