Tesco 2003 Annual Report Download - page 3
Download and view the complete annual report
Please find page 3 of the 2003 Tesco annual report below. You can navigate through the pages in the report by either clicking on the pages listed below, or by using the keyword search tool below to find specific information within the annual report.-
 1
1 -
 2
2 -
 3
3 -
 4
4 -
 5
5 -
 6
6 -
 7
7 -
 8
8 -
 9
9 -
 10
10 -
 11
11 -
 12
12 -
 13
13 -
 14
14 -
15
-
16
-
17
-
18
-
19
-
20
-
21
-
22
-
23
-
24
-
25
-
26
-
27
-
28
-
29
-
30
-
31
-
32
-
33
-
34
-
35
-
36
-
37
-
38
-
39
-
40
-
41
-
42
-
43
-
44
-
45
-
46
-
47
-
48
-
49
-
50
-
51
-
52
-
53
-
54
-
55
-
56
-
57
-
58
-
59
-
60
 |
 |

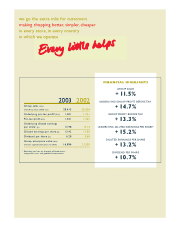
FINANCIAL HIGHLIGHTS
GROUP SALES
+11.5%
UNDERLYING GROUP PROFIT BEFORE TAX†
+14.7%
GROUP PROFIT BEFORE TAX
+13.3%
UNDERLYING DILUTED EARNINGS PER SHARE†
+15.2%
DILUTED EARNINGS PER SHARE
+13.2%
DIVIDEND PER SHARE
+10.7%
2003 2002
Group sales (£m)
(including value added tax) 28,613 25,654
Underlying pre-tax profit†(£m) 1,401 1,221
Pre-tax profit (£m) 1,361 1,201
Underlying diluted earnings
per share† (p) 13.98 12.14
Diluted earnings per share (p) 13.42 11.86
Dividend per share (p) 6.20 5.60
Group enterprise value (£m)
(market capitalisation plus net debt) 16,896 21,290
†Excluding net loss on disposal of fixed assets,
integration costs and goodwill amortisation.
we go the extra mile for customers
making shopping better, simpler, cheaper
in every store, in every country
in which we operate