Tesco 2003 Annual Report Download - page 56
Download and view the complete annual report
Please find page 56 of the 2003 Tesco annual report below. You can navigate through the pages in the report by either clicking on the pages listed below, or by using the keyword search tool below to find specific information within the annual report.-
 1
1 -
2
-
3
-
4
-
5
-
6
-
7
-
8
-
9
-
10
-
11
-
12
-
13
-
14
-
15
-
16
-
17
-
18
-
19
-
20
-
21
-
22
-
23
-
24
-
25
-
26
-
27
-
28
-
29
-
30
-
31
-
32
-
33
-
34
-
35
-
36
-
37
-
38
-
39
-
40
-
41
-
42
-
43
-
44
-
45
-
 46
46 -
 47
47 -
 48
48 -
 49
49 -
 50
50 -
 51
51 -
 52
52 -
 53
53 -
 54
54 -
 55
55 -
 56
56 -
 57
57 -
 58
58 -
 59
59 -
 60
60
 |
 |

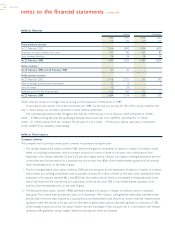
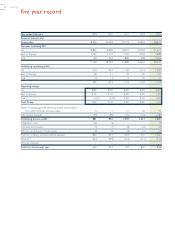
54 TESCO PLC
Year ended February 1999 2000 2001 2002 2003
Financial statistics £m
Group sales 18,546 20,358 22,773 25,654 28,613
Turnover excluding VAT
UK 15,835 16,958 18,372 20,052 21,615
Rest of Europe 1,167 1,374 1,756 2,203 2,689
Asia 156 464 860 1,398 2,033
17,158 18,796 20,988 23,653 26,337
Underlying operating profit 1
UK 919 993 1,100 1,213 1,297
Rest of Europe 48 51 70 90 141
Asia (2) (1) 4 29 71
965 1,043 1,174 1,332 1,509
Operating margin 1
UK 5.8% 5.9% 6.0% 6.0% 6.0%
Rest of Europe 4.1% 3.7% 4.0% 4.1% 5.2%
Asia (1.3)% (0.2)% 0.5% 2.1% 3.5%
Total Group 5.6% 5.5% 5.6% 5.6% 5.7%
Share of operating profit before goodwill amortisation
from joint ventures and associates 6 11 21 42 72
Net interest payable (90) (99) (125) (153) (180)
Underlying pre-tax profit 2881 955 1,070 1,221 1,401
Integration costs (26) (6) – – (4)
Goodwill amortisation (5) (7) (8) (10) (23)
Net loss on disposal of fixed assets (8) (9) (8) (10) (13)
Profit on ordinary activities before taxation 842 933 1,054 1,201 1,361
Taxation 3(237) (259) (333) (371) (415)
Minority interests 1–1––
Profit for the financial year 3606 674 722 830 946
five year record