Tesco 2003 Annual Report Download - page 4
Download and view the complete annual report
Please find page 4 of the 2003 Tesco annual report below. You can navigate through the pages in the report by either clicking on the pages listed below, or by using the keyword search tool below to find specific information within the annual report.-
 1
1 -
 2
2 -
 3
3 -
 4
4 -
 5
5 -
 6
6 -
 7
7 -
 8
8 -
 9
9 -
 10
10 -
 11
11 -
 12
12 -
 13
13 -
 14
14 -
 15
15 -
16
-
17
-
18
-
19
-
20
-
21
-
22
-
23
-
24
-
25
-
26
-
27
-
28
-
29
-
30
-
31
-
32
-
33
-
34
-
35
-
36
-
37
-
38
-
39
-
40
-
41
-
42
-
43
-
44
-
45
-
46
-
47
-
48
-
49
-
50
-
51
-
52
-
53
-
54
-
55
-
56
-
57
-
58
-
59
-
60
 |
 |

2TESCO PLC
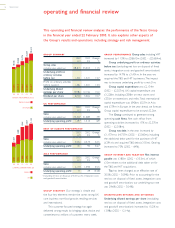
This operating and financial review analyses the performance of the Tesco Group
in the financial year ended 22 February 2003. It also explains other aspects of
the Group’s results and operations, including strategy and risk management.
operating and financial review
99 00 01 0302
GROUP PERFORMANCE £m
28,613
25,654
22,773
20,358
18,546
23,40723,407
21,68521,685
19,88419,884
18,33418,334
17,09117,091
GROUP SALES
UK SALES
99 00 01 0302
CAPITAL EXPENDITURE £m
2,134
2,027
1,944
1,488
1,067
1,2281,228
1,2761,276
1,2061,206
989989
848848
GROUP
UK
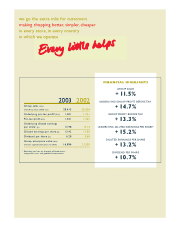
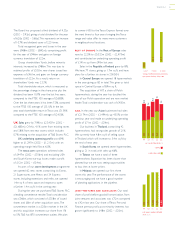
GROUP PERFORMANCE Group sales including VAT
increased by 11.5% to £28,613m (2002 – £25,654m).
Group underlying profit on ordinary activities
before tax (excluding net loss on disposal of fixed
assets, integration costs and goodwill amortisation)
increased by 14.7% to £1,401m. In the year, we
acquired the T&S and HIT businesses.The impact
was to increase underlying profit by a net £1m.
Group capital expenditure was £2,134m
(2002 – £2,027m). UK capital expenditure was
£1,228m, including £558m on new stores and
£335m on extensions and refits.Total international
capital expenditure was £906m, £527m in Asia
and £379m in Europe. In the year ahead, we forecast
Group capital expenditure to be around £2.2bn.
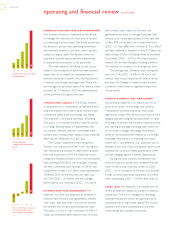
The Group continued to generate strong
operating cash flows. Net cash inflow from
operating activities increased by 17% to £2,375m
(2002 – £2,038m).
Group net debt in the year increased by
£1,177m to £4,737m (2002 – £3,560m), including
the additional debt used for the purchase of HIT
(£391m) and acquired T&S debt (£155m). Gearing
increased to 73% (2002 – 64%).
GROUP INTEREST AND TAXATION Net interest
payable was £180m (2002 – £153m), of which
£10m relates to the additional debt taken on for
the T&S and HIT acquisitions.
Ta x has been charged at an effective rate of
30.5% (2002 – 30.9%). Prior to accounting for the
net loss on disposal of fixed assets, integration costs
and goodwill amortisation, our underlying tax rate
was 29.6% (2002 – 30.4%).
SHAREHOLDER RETURNS AND DIVIDENDS
Underlying diluted earnings per share (excluding
net loss on disposal of fixed assets, integration costs
and goodwill amortisation) increased by 15.2% to
13.98p (2002 – 12.14p).
GROUP SUMMARY
2003 2002 Change
£m £m %
Group sales
(including value added tax) 28,613 25,654 11.5
Underlying profit on
ordinary activities
before tax†1,401 1,221 14.7
Profit on ordinary activities
before taxation 1,361 1,201 13.3
Underlying diluted
earnings per share†13.98p 12.14p 15.2
Dividend per share 6.20p 5.60p 10.7
UK PERFORMANCE
2003 2002 Change
£m £m %
Sales
(including value added tax) 23,407 21,685 7.9
Underlying operating profit†1,297 1,213 6.9
REST OF EUROPE PERFORMANCE
2003 2002 Change
£m £m %
Sales
(including value added tax) 3,032 2,475 22.5
Underlying operating profit†141 90 56.7
ASIA PERFORMANCE
2003 2002 Change
£m £m %
Sales
(including value added tax) 2,174 1,494 45.5
Underlying operating profit†71 29 144.8
†Excluding net loss on disposal of fixed assets, integration costs
and goodwill amortisation.
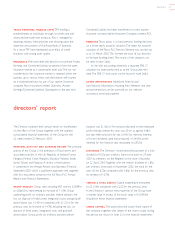
GROUP STRATEGY Our strategy is simple and
the four key elements remain the same: strong UK
core business; non-food growth; retailing services
and international.
This customer focused strategy has again
delivered strong results by bringing value, choice and
convenience to millions of customers every week.