Tesco 2003 Annual Report Download - page 35
Download and view the complete annual report
Please find page 35 of the 2003 Tesco annual report below. You can navigate through the pages in the report by either clicking on the pages listed below, or by using the keyword search tool below to find specific information within the annual report.-
 1
1 -
2
-
3
-
4
-
5
-
6
-
7
-
8
-
9
-
10
-
11
-
12
-
13
-
14
-
15
-
16
-
17
-
18
-
19
-
20
-
21
-
22
-
23
-
24
-
 25
25 -
 26
26 -
 27
27 -
 28
28 -
 29
29 -
 30
30 -
 31
31 -
 32
32 -
 33
33 -
 34
34 -
 35
35 -
 36
36 -
 37
37 -
 38
38 -
 39
39 -
 40
40 -
 41
41 -
 42
42 -
 43
43 -
 44
44 -
 45
45 -
46
-
47
-
48
-
49
-
50
-
51
-
52
-
53
-
54
-
55
-
56
-
57
-
58
-
59
-
60
 |
 |

TESCO PLC 33
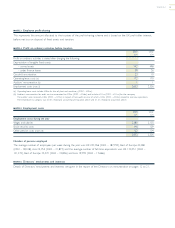
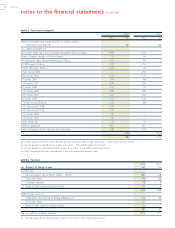
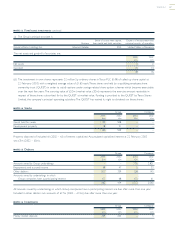
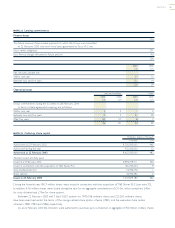
NOTE 8 Taxation continued
(b) Factors affecting the tax charge for the year
The effective rate of corporation tax for the year of 25.9% (2002 – 28.0%) is lower than the standard rate of corporation
tax in the UK of 30.0%.The differences are explained below:
2003 2002
%%
Standard rate of corporation tax 30.0 30.0
Effects of:
Expenses not deductible for tax purposes (primarily goodwill amortisation and non-qualifying depreciation) 3.9 3.4
Capital allowances for the year in excess of depreciation on qualifying assets (3.3) (2.8)
Differences in overseas taxation rates (0.8) (0.4)
Losses on property disposals not available for current tax relief – 0.3
Prior year items (4.4) (2.4)
Other items 0.5 (0.1)
Effective rate of corporation tax for the year 25.9 28.0
(c) Factors that may affect future tax charges
Deferred tax assets of £16m in respect of tax losses carried forward have not been recognised due to insufficient
certainty over their recoverability.
NOTE 9 Dividends
2003 2002 2003 2002
Pence/share Pence/share
£m £m
Declared interim 1.87 1.67 131 115
Proposed final 4.33 3.93 312 275
6.20 5.60 443 390
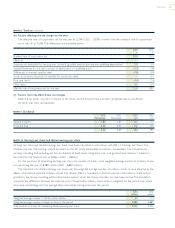
NOTE 10 Earnings per share and diluted earnings per share
Earnings per share and diluted earnings per share have been calculated in accordance with FRS 14, ‘Earnings per Share’.The
standard requires that earnings should be based on the net profit attributable to ordinary shareholders.The calculation for
earnings, including and excluding net loss on disposal of fixed assets, integration costs and goodwill amortisation, is based on
the profit for the financial year of £946m (2002 – £830m).
For the purposes of calculating earnings per share, the number of shares is the weighted average number of ordinary shares
in issue during the year of 6,989 million (2002 – 6,887 million).
The calculation for diluted earnings per share uses the weighted average number of ordinary shares in issue adjusted by the
effects of all dilutive potential ordinary shares.The dilution effect is calculated on the full exercise of all ordinary share options
granted by the Group, including performance-based options which the Group considers to have been earned.The calculation
compares the difference between the exercise price of exercisable ordinary share options, weighted for the period over which
they were outstanding, with the average daily mid-market closing price over the period.
2003 2002
million million
Weighted average number of dilutive share options 62 114
Weighted average number of shares in issue in the period 6,989 6,887
Total number of shares for calculating diluted earnings per share 7,051 7,001