Tesco 2003 Annual Report Download - page 26
Download and view the complete annual report
Please find page 26 of the 2003 Tesco annual report below. You can navigate through the pages in the report by either clicking on the pages listed below, or by using the keyword search tool below to find specific information within the annual report.-
 1
1 -
2
-
3
-
4
-
5
-
6
-
7
-
8
-
9
-
10
-
11
-
12
-
13
-
14
-
15
-
 16
16 -
 17
17 -
 18
18 -
 19
19 -
 20
20 -
 21
21 -
 22
22 -
 23
23 -
 24
24 -
 25
25 -
 26
26 -
 27
27 -
 28
28 -
 29
29 -
 30
30 -
 31
31 -
 32
32 -
 33
33 -
 34
34 -
 35
35 -
 36
36 -
37
-
38
-
39
-
40
-
41
-
42
-
43
-
44
-
45
-
46
-
47
-
48
-
49
-
50
-
51
-
52
-
53
-
54
-
55
-
56
-
57
-
58
-
59
-
60
 |
 |

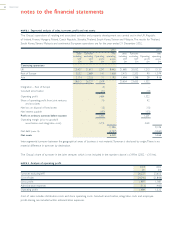
24 TESCO PLC
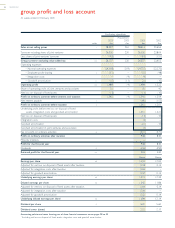
group profit and loss account
52 weeks ended 22 February 2003
Continuing operations
Acquisitions
2003 2003 2003 2002
note £m £m £m £m
Sales at net selling prices 128,352 261 28,613 25,654
Turnover including share of joint ventures 26,300 230 26,530 23,804
Less: share of joint ventures’ turnover (193) – (193) (151)
Group turnover excluding value added tax 1/2 26,107 230 26,337 23,653
Operating expenses
– Normal operating expenses (24,558) (219) (24,777) (22,273)
– Employee profit-sharing 3(51) – (51) (48)
– Integration costs – (4) (4) –
– Goodwill amortisation 11 (10) (11) (21) (10)
Operating profit 1/2 1,488 (4) 1,484 1,322
Share of operating profit of joint ventures and associates 70 – 70 42
Net loss on disposal of fixed assets (13) – (13) (10)
Profit on ordinary activities before interest and taxation 1,545 (4) 1,541 1,354
Net interest payable 7(180) (153)
Profit on ordinary activities before taxation 41,361 1,201
Underlying profit before net loss on disposal of fixed
assets, integration costs and goodwill amortisation 1,401 1,221
Net loss on disposal of fixed assets (13) (10)
Integration costs (4) –
Goodwill amortisation (21) (10)
Goodwill amortisation in joint ventures and associates (2) –
Tax on profit on ordinary activities 8(415) (371)
Profit on ordinary activities after taxation 946 830
Minority interests ––
Profit for the financial year 946 830
Dividends 9(443) (390)
Retained profit for the financial year 24 503 440
Pence Pence
Earnings per share 10 13.54 12.05
Adjusted for net loss on disposal of fixed assets after taxation 0.18 0.14
Adjusted for integration costs after taxation 0.06 –
Adjusted for goodwill amortisation 0.32 0.14
Underlying earnings per share†10 14.10 12.33
Diluted earnings per share 10 13.42 11.86
Adjusted for net loss on disposal of fixed assets after taxation 0.18 0.14
Adjusted for integration costs after taxation 0.06 –
Adjusted for goodwill amortisation 0.32 0.14
Underlying diluted earnings per share†10 13.98 12.14
Dividend per share 96.20 5.60
Dividend cover (times) 2.25 2.17
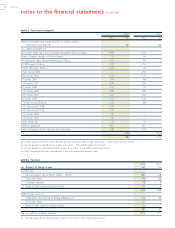
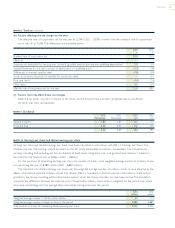
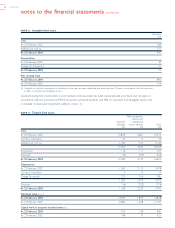
Accounting policies and notes forming part of these financial statements are on pages 28 to 53.
†Excluding net loss on disposal of fixed assets, integration costs and goodwill amortisation.