Tesco 2003 Annual Report Download - page 51
Download and view the complete annual report
Please find page 51 of the 2003 Tesco annual report below. You can navigate through the pages in the report by either clicking on the pages listed below, or by using the keyword search tool below to find specific information within the annual report.-
 1
1 -
2
-
3
-
4
-
5
-
6
-
7
-
8
-
9
-
10
-
11
-
12
-
13
-
14
-
15
-
16
-
17
-
18
-
19
-
20
-
21
-
22
-
23
-
24
-
25
-
26
-
27
-
28
-
29
-
30
-
31
-
32
-
33
-
34
-
35
-
36
-
37
-
38
-
39
-
40
-
 41
41 -
 42
42 -
 43
43 -
 44
44 -
 45
45 -
 46
46 -
 47
47 -
 48
48 -
 49
49 -
 50
50 -
 51
51 -
 52
52 -
 53
53 -
 54
54 -
 55
55 -
 56
56 -
 57
57 -
 58
58 -
 59
59 -
 60
60
 |
 |

TESCO PLC 49
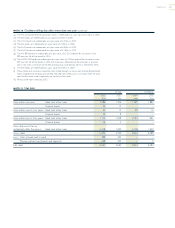
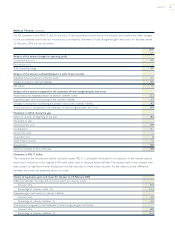
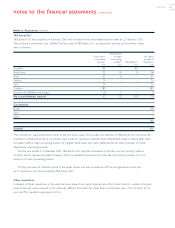
NOTE 26 Pensions continued
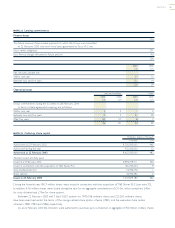
On full compliance with FRS 17, and on the basis of the assumptions noted above, the amounts that would have been charged
to the consolidated profit and loss account and consolidated statement of total recognised gains and losses for the year ended
22 February 2003 are set out below:
2003
£m
Analysis of the amount charged to operating profit
Current service cost 149
Past service cost –
Total operating charge 149
Analysis of the amount credited/(charged) to other finance income
Expected return on pension schemes’ assets 115
Interest on pension schemes’ liabilities (101)
Net return 14
Analysis of the amount recognised in the statement of total recognised gains and losses
Actual return less expected return on pension schemes’ assets (323)
Experience gains and losses arising on the schemes’ liabilities (53)
Changes in assumptions underlying the present value of the schemes’ liabilities (193)
Total actuarial loss recognised in the statement of total recognised gains and losses (569)
Movement in deficit during the year
Deficit in schemes at beginning of the year (184)
Movement in year:
Current service cost (149)
Contributions 121
Past service costs –
Acquisition cost (2)
Other finance income 14
Actuarial loss (569)
Deficit in schemes at end of the year (769)
Movement in FRS 17 deficit
The increase in the net pension liability calculated under FRS 17 is principally attributable to a reduction in the market value of
assets and a reduction in the long-term AA bond yields used to discount future liabilities.The equities held in the schemes have
been subject to significant market fluctuations and the reduction in share values accounts for the majority of the difference
between the actual and expected return on assets.
History of experience gains and losses for the year to 22 February 2003
Difference between the expected and actual return on schemes’ assets:
Amount (£m) (323)
Percentage of schemes’ assets (%) (21.4)
Experience gains and losses on schemes’ liabilities:
Amount (£m) (53)
Percentage of schemes’ liabilities (%) (2.3)
Total amount recognised in the statement of total recognised gains and losses:
Amount (£m) (569)
Percentage of schemes’ liabilities (%) (25.0)