Suzuki 2007 Annual Report Download - page 5
Download and view the complete annual report
Please find page 5 of the 2007 Suzuki annual report below. You can navigate through the pages in the report by either clicking on the pages listed below, or by using the keyword search tool below to find specific information within the annual report.-
 1
1 -
 2
2 -
 3
3 -
 4
4 -
 5
5 -
 6
6 -
 7
7 -
 8
8 -
 9
9 -
 10
10 -
 11
11 -
 12
12 -
 13
13 -
 14
14 -
 15
15 -
 16
16 -
17
-
18
-
19
-
20
-
21
-
22
-
23
-
24
-
25
-
26
-
27
-
28
-
29
-
30
-
31
-
32
-
33
-
34
-
35
-
36
-
37
-
38
-
39
-
40
-
41
-
42
-
43
-
44
-
45
-
46
-
47
-
48
-
49
-
50
-
51
-
52
-
53
-
54
-
55
 |
 |
SUZUKI MOTOR CORPORATION
YEAR IN REVIEW
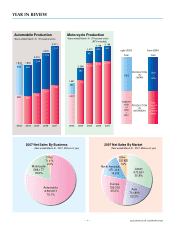
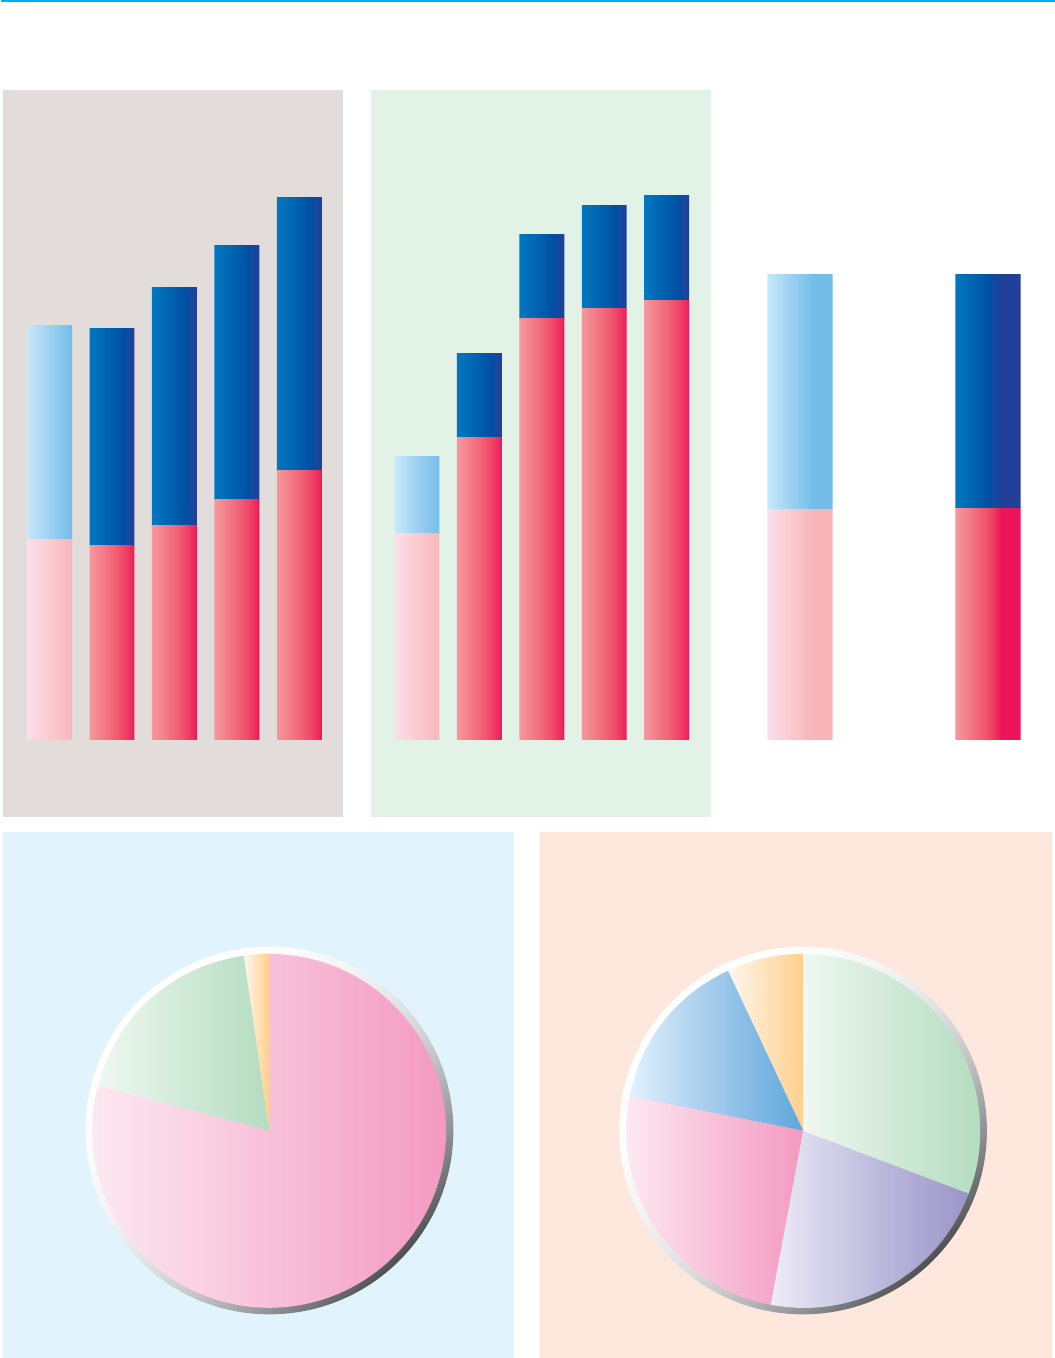
Automobile
2,503,817
79.1%
2007 Net Sales By Business 2007 Net Sales By Market
Automobile Production
Years ended March 31 (Thousand units)
(Year ended March 31, 2007, Millions of yen) (Year ended March 31, 2007, Millions of yen)
2003 2004
Japan
973,501
30.8%
Other
220,825
7.0%
North America
471,114
14.9%
Europe
796,330
25.2% Asia
701,896
22.2%
Other
71,674
2.3%
Motorcycle
588,177
18.6%
1,843
952
2005
891
1,830
967
2006
863
2,010
1,058
952
2,200
1,133
1,067
2,411
1,212
1,199
from 2004upto 2003
Motorcycle Production
Years ended March 31 (Thousand units)
(ATV included)
2003 2004
1,210
1,661
451
2005
1,775
2,268
493
2,473
2,970
497
2,533
3,138
605
2,577
3,198
621
20062007 2007
PRODUCTION
IN
JAPAN
PRODUCTION
IN
OVERSEAS
CBU
Shipment
units
of
CKD
+
SET
Total
CBU
+
CKD
Total
line-off
units
at each
plants
Total
4