Suzuki 2007 Annual Report Download - page 48
Download and view the complete annual report
Please find page 48 of the 2007 Suzuki annual report below. You can navigate through the pages in the report by either clicking on the pages listed below, or by using the keyword search tool below to find specific information within the annual report.-
 1
1 -
2
-
3
-
4
-
5
-
6
-
7
-
8
-
9
-
10
-
11
-
12
-
13
-
14
-
15
-
16
-
17
-
18
-
19
-
20
-
21
-
22
-
23
-
24
-
25
-
26
-
27
-
28
-
29
-
30
-
31
-
32
-
33
-
34
-
35
-
36
-
37
-
 38
38 -
 39
39 -
 40
40 -
 41
41 -
 42
42 -
 43
43 -
 44
44 -
 45
45 -
 46
46 -
 47
47 -
 48
48 -
 49
49 -
 50
50 -
 51
51 -
 52
52 -
 53
53 -
 54
54 -
 55
55
 |
 |

SUZUKI MOTOR CORPORATION
2006
Europe
North America
Asia
Other areas
*2
Consolidated
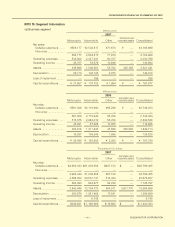
Overseas sales ................ ¥587,429 ¥411,327 ¥647,695 ¥165,496 ¥1,811,948
Consolidated net sales ....................................................................................... 2,746,453
Ratio of overseas sales
to consolidated net sales ...
21.4% 15.0% 23.6% 6.0% 66.0%
2007
Europe
North America
Asia
Other areas
*2
Consolidated
Overseas sales ................. $6,745,709 $3,990,808 $5,945,755 $1,870,611 $18,552,885
Consolidated net sales .............................................................................................. 26,799,405
Ratio of overseas sales
to consolidated net sales ...
25.1% 14.9% 22.2% 7.0% 69.2%
*2 “Other areas” consists principally of Oceania and South America.
Thousands of U. S. dollars
2007
Europe
North America
Asia
Other areas*2
Consolidated
Overseas sales ................ ¥796,330 ¥471,114 ¥701,896 ¥220,825 ¥2,190,168
Consolidated net sales ................................................................................................
3,163,669
Ratio of overseas sales
to consolidated net sales ....
25.1% 14.9% 22.2% 7.0% 69.2%
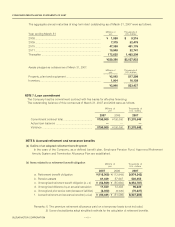
(c) Overseas sales
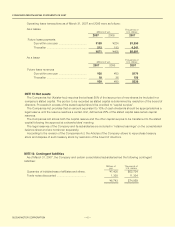
NOTE 17: Subsequent events
The following plan for the appropriation of retained earnings for the year ended March 31, 2007 was approved
by the ordinary general meeting of shareholders of the Company held on June 28, 2007:
Millions of Thousands of
yen U.S. dollars
Year-end cash dividends ...................................................... ¥3,607 $30,559
Millions of yen
CONSOLIDATED FINANCIAL STATEMENTS OF 2007
Millions of yen
48
NOTE 16: Loss of Impairment
The assets are divided into two groups, i.e. the assets for business and the assets for rent respectively in
business places. Since land prices have dropped continuously, mainly book value of the assets groups as
marketing base was decreased to the recoverable amount. As a result of this change, “income before income
taxes” decreased by 796 million yen for land.
The amount is included in “other income and expenses” of Consolidated Statements of Income.