Suzuki 2007 Annual Report Download - page 27
Download and view the complete annual report
Please find page 27 of the 2007 Suzuki annual report below. You can navigate through the pages in the report by either clicking on the pages listed below, or by using the keyword search tool below to find specific information within the annual report.-
 1
1 -
2
-
3
-
4
-
5
-
6
-
7
-
8
-
9
-
10
-
11
-
12
-
13
-
14
-
15
-
16
-
 17
17 -
 18
18 -
 19
19 -
 20
20 -
 21
21 -
 22
22 -
 23
23 -
 24
24 -
 25
25 -
 26
26 -
 27
27 -
 28
28 -
 29
29 -
 30
30 -
 31
31 -
 32
32 -
 33
33 -
 34
34 -
 35
35 -
 36
36 -
 37
37 -
38
-
39
-
40
-
41
-
42
-
43
-
44
-
45
-
46
-
47
-
48
-
49
-
50
-
51
-
52
-
53
-
54
-
55
 |
 |

SUZUKI MOTOR CORPORATION
Years ended March 31 2007 2006 2005 2004 2003 2007
Net sales ............................... ¥3,163,669 ¥2,746,453 ¥2,365,571 ¥2,198,986 ¥2,015,309 $26,799,405
Net income ............................ 75,008 65,945 60,506 43,835 31,024 635,394
Net income per share:
Primary .............................. 169.41 125.64 112.94 81.38 57.29 1.435
Fully diluted ....................... 151.41 122.14 109.86 79.17 55.57 1.282
Cash dividends per share..... 14.00 11.00 10.00 9.00 9.00 0.118
Net Assets ............................. 855,973 616,770 745,016 692,345 648,357 7,250,936
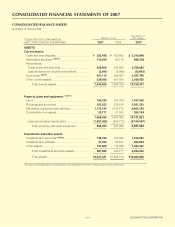
Total current assets............... 1,435,405 1,067,709 999,887 902,263 844,577 12,159,301
Total assets ........................... 2,321,441 1,849,714 1,693,353 1,577,709 1,537,430 19,664,898
Depreciation and amortization 149,910 126,520 97,731 87,858 83,896 1,269,889
SUZUKI MOTOR CORPORATION
CONSOLIDATED
NON-CONSOLIDATED
Thousands of
U.S. dollars
(except per
share amounts)
Years ended March 31 2007 2006 2005 2004 2003 2007
Net sales ............................... ¥1,939,806 ¥1,690,169 ¥1,481,632 ¥1,392,688 ¥1,411,418 $16,432,078
Net income ............................ 43,054 37,271 35,747 25,650 19,393 364,710
Net income per share:
Primary .............................. 97.23 70.78 66.56 47.46 35.67 0.823
Fully diluted ....................... 86.91 68.82 64.75 46.17 34.61 0.736
Cash dividends per share..... 14.00 11.00 10.00 9.00 9.00 0.118
Net Assets ............................. 429,730 364,127 540,890 518,198 483,670 3,640,243
Total current assets............... 758,005 518,728 589,848 519,025 539,322 6,421,052
Total assets ........................... 1,381,889 1,082,344 1,098,073 1,039,261 1,070,708 11,705,969
Depreciation and amortization 73,881 59,362 47,213 47,836 53,578 625,851
Note: Yen amounts are translated into U.S. dollars for convenience only, at ¥118.05 = US$1, the prevailing exchange rate as of March 31, 2007.
Calculation of net income per share from the year of 2003 to 2006 is made on the adjusted net income basis excluding the bonuses paid to
directors and corporate auditors and the payment of dividends to shareholders of preferred stocks from net income shown in the income
statements in accordance with the revision of regulations of financial statements.
Figures in “Net assets” of FY2006 and before are referred to “Shareholder’s equity” in previous, respectively.
Millions of yen
(except per share amounts)
Thousands of
U.S. dollars
(except per
share amounts)
Millions of yen
(except per share amounts)
FIVE-YEAR SUMMARY
27