Suzuki 2007 Annual Report Download - page 33
Download and view the complete annual report
Please find page 33 of the 2007 Suzuki annual report below. You can navigate through the pages in the report by either clicking on the pages listed below, or by using the keyword search tool below to find specific information within the annual report.-
 1
1 -
2
-
3
-
4
-
5
-
6
-
7
-
8
-
9
-
10
-
11
-
12
-
13
-
14
-
15
-
16
-
17
-
18
-
19
-
20
-
21
-
22
-
 23
23 -
 24
24 -
 25
25 -
 26
26 -
 27
27 -
 28
28 -
 29
29 -
 30
30 -
 31
31 -
 32
32 -
 33
33 -
 34
34 -
 35
35 -
 36
36 -
 37
37 -
 38
38 -
 39
39 -
 40
40 -
 41
41 -
 42
42 -
 43
43 -
44
-
45
-
46
-
47
-
48
-
49
-
50
-
51
-
52
-
53
-
54
-
55
 |
 |

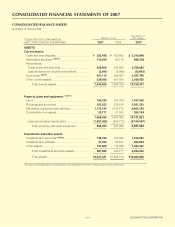
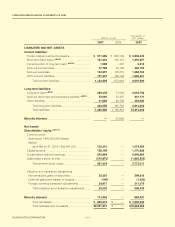
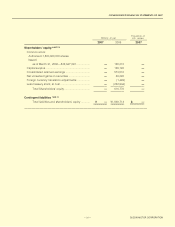
SUZUKI MOTOR CORPORATION
CONSOLIDATED STATEMENTS OF CASH FLOWS
Years ended March 31, 2007 and 2006
Cash flows from operating activities
Income before income taxes..................................... ¥138,732 ¥121,844 $1,175,201
Depreciation and amortization expenses ................. 149,910 126,520 1,269,889
Loss of impairment .................................................... 796 —6,745
Equity in earnings of affiliates ................................... (2,102) (3,933) (17,812)
Decrease in accrued retirement
and severance benefits ............................................ (1,750) (1,210) (14,831)
Interest and dividend income ................................... (15,172) (11,771) (128,529)
Interest expenses ...................................................... 6,810 3,554 57,693
Increase in accounts receivable ............................... (64,137) (22,942) (543,304)
Increase in inventories .............................................. (28,623) (54,935) (242,473)
Increase in accounts payable ................................... 53,805 115,988 455,784
Others ........................................................................ 21,283 14,519 180,290
Sub Total 259,551 287,634 2,198,654
Interest and dividends received ............................... 14,747 10,795 124,926
Interest paid .............................................................. (5,780) (3,505) (48,964)
Income taxes paid ..................................................... (66,324) (54,881) (561,830)
Net cash provided by operating activities 202,194 240,043 1,712,785
Cash flows from investing activities
Deposit in time deposit .............................................. (56,335) (108,942) (477,217)
Disbursement from time deposit................................ 62,635 142,311 530,584
Purchases of marketable securities........................... (57,383) (68,314) (486,098)
Proceeds from sales of marketable securities........... 71,940 83,582 609,403
Purchases of property, plants and equipment .......... (173,064) (160,256) (1,466,027)
Proceeds from sales of property, plants and equipment 4,561 4,005 38,640
Purchases of investment securities ........................... (55,330) (52) (468,701)
Proceeds from sales of investment securities ........... 4,760 14,779 40,328
Increase in other investment ..................................... (1,345) (7,921) (11,396)
Increase in loans receivable ...................................... —(1,747) —
Others ........................................................................ 87 (1,659) 744
Net cash used in investing activities (199,473) (104,215) (1,689,739)
Cash flows from financing activities
Net increase in short term bank loans ...................... 32,296 38,233 273,580
Proceeds from long term debt and issuance of bonds 166,870 39,472 1,413,557
Repayment from long term debt and redemption of bonds (1,028) (6,480) (8,709)
Cash dividends paid ................................................. (6,943) (6,650) (58,820)
Purchases of treasury stock ...................................... (19) (235,782) (161)
Proceeds from sales of treasury stock ...................... 32,085 10,481 271,798
Others ........................................................................ 29 —247
Net cash used in and provided by financing activities 223,290 (160,725) 1,891,492
Effect of exchange rate change on cash and cash equivalents
1,700 9,890 14,407
Cash and cash equivalents increased (decreased) 227,712 (15,006) 1,928,946
Cash and cash equivalents at beginning of year 216,623 231,397 1,835,011
Increase by inclusion of newly consolidated subsidiaries
—232 —
Cash and cash equivalents at end of year *NOTE 11 ¥444,335 ¥216,623 $3,763,958
The accompanying Notes to Consolidated Financial Statements are an integral part of these statements.
Thousands of
U.S. dollars
SUZUKI MOTOR CORPORATION
AND CONSOLIDATED SUBSIDIARIES 2007 2006 2007
Millions of yen
CONSOLIDATED FINANCIAL STATEMENTS OF 2007
33