Suzuki 2007 Annual Report Download - page 25
Download and view the complete annual report
Please find page 25 of the 2007 Suzuki annual report below. You can navigate through the pages in the report by either clicking on the pages listed below, or by using the keyword search tool below to find specific information within the annual report.-
 1
1 -
2
-
3
-
4
-
5
-
6
-
7
-
8
-
9
-
10
-
11
-
12
-
13
-
14
-
 15
15 -
 16
16 -
 17
17 -
 18
18 -
 19
19 -
 20
20 -
 21
21 -
 22
22 -
 23
23 -
 24
24 -
 25
25 -
 26
26 -
 27
27 -
 28
28 -
 29
29 -
 30
30 -
 31
31 -
 32
32 -
 33
33 -
 34
34 -
 35
35 -
36
-
37
-
38
-
39
-
40
-
41
-
42
-
43
-
44
-
45
-
46
-
47
-
48
-
49
-
50
-
51
-
52
-
53
-
54
-
55
 |
 |

SUZUKI MOTOR CORPORATION
(3) Selling, general and administrative expenses
In this fiscal year, the amount of selling, general and administrative expenses increased by 52,172 million yen to
652,027 million yen. The expense of dispatch, advertising, sales promotion and warranty reserve increased
according to increase of sales. Also R&D expenses increased due to development of new product, advanced safety
technology, next generation vehicle such as fuel cell vehicle, etc.
(4) Other income and expenses
In this fiscal year, the net amount of other income and expenses was a profit of 5,832 million yen thanks for
dividend inome, while in the previous fiscal year net profit was 7,978 million yen. Due to decrease of gain on sales of
investment in securities and increase of impairment loss of fixed assets which none in the previous year, the net profit
of this fiscal year decreased by 2,146 million yen against previous fiscal year.
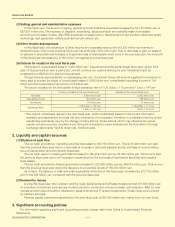
(5) Outlook for results in the next fiscal year
The target of “consolidated sales of 3,000 billion yen” was achieved at the earlier stage. Next year, as the third
year of “Suzuki medium term 5-year plan”, we will continue our positive working for prior investment such as
investments on R&D and on plant and equipment.
Though there is unpredictability on exchanging rate, etc., the Suzuki Group will work all together for innovation in
every area to exceed the target of consolidated sales of 3,200 billion yen, consolidated operating income of 134
billion yen and consolidated net income of 76 billion yen.
The above is based on the anticipated foreign exchange rate of 1 US dollar = 112 yen and 1 Euro = 147 yen.
*The outlook of business results in the next fiscal year, which is estimated based on the current information
available and assumption, includes risk and uncertainty. It is requested, therefore, to understand that the actual
results may extensively vary by the change of many factors. Those factors, which may influence the actual
results, include economic conditions and the trend of demand in major markets and the fluctuation of foreign
exchange rate (mainly Yen/US dollar rate, Yen/Euro rate).
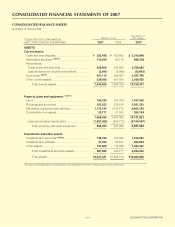
2. Liquidity and capital resources
(1) Situation of cash flow
The net cash provided by operating activities decreased to 202,194 million yen. This is 37,849 million yen less
than the previous fiscal year due to a decrease of increase in accounts payable and an increase of income before
tax and depreciation and amortization expenses.
The net cash used in investing activities increased to 199,473 million yen by 95,258 million yen. This is more than
the previous fiscal year due to an increase in expenditure for the purchase of marketable securities and tangible
fixed assets.
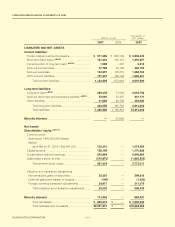
The net cash provided by financing activities increased to 223,290 million yen by 384,016 million yen. This is more
than the previous fiscal year due to the issuance of convertible bonds of 150,000 million yen.
As a result, the balance of cash and cash equivalents at the end of this fiscal year increased by 227,712 million
yen to 444,335 million yen compared with the previous fiscal year.
(2) Demand for money
During this fiscal year, the Company and the major subsidiaries and affiliates invested a total 207,386 million yen
on a number of initiatives, such as new model production, production volume increase, rationalization, R&D for new
models and technical innovation, distribution, sales channel and IT related investments. These costs were covered
by retained earnings.
Planned capital expenditure spending for the next fiscal year is 250,000 million yen, mainly from our own funds.
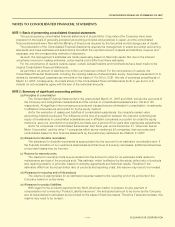
3. Significant accounting policies
For information regarding significant accounting policies, please refer to the Notes to Consolidated Financial
Statements.
FINANCIAL REVIEW
25
Outlook of results in the next fiscal year Results in the current fiscal year
Net sales 3,200 billion yen 3,163 billion yen
Operating income 134 billion yen 132 billion yen
Net income 76 billion yen 75 billion yen
Exchange Rate 1 US dollar = 112 yen 1 US dollar = 117 yen
1 Euro = 147 yen 1 Euro = 151 yen