Suzuki 2007 Annual Report Download - page 38
Download and view the complete annual report
Please find page 38 of the 2007 Suzuki annual report below. You can navigate through the pages in the report by either clicking on the pages listed below, or by using the keyword search tool below to find specific information within the annual report.-
 1
1 -
2
-
3
-
4
-
5
-
6
-
7
-
8
-
9
-
10
-
11
-
12
-
13
-
14
-
15
-
16
-
17
-
18
-
19
-
20
-
21
-
22
-
23
-
24
-
25
-
26
-
27
-
 28
28 -
 29
29 -
 30
30 -
 31
31 -
 32
32 -
 33
33 -
 34
34 -
 35
35 -
 36
36 -
 37
37 -
 38
38 -
 39
39 -
 40
40 -
 41
41 -
 42
42 -
 43
43 -
 44
44 -
 45
45 -
 46
46 -
 47
47 -
 48
48 -
49
-
50
-
51
-
52
-
53
-
54
-
55
 |
 |

SUZUKI MOTOR CORPORATION
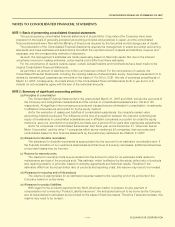
Millions of yen
Millions of yen
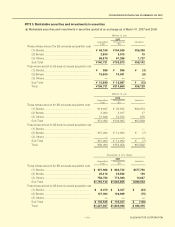
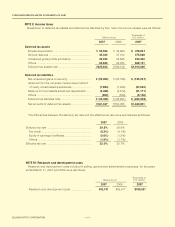
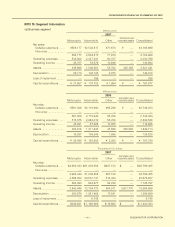
NOTE 5: Marketable securities and investments in securities
(a) Marketable securities and investments in securities quoted at an exchange as of March 31, 2007 and 2006
Those whose amount for BS exceeds acquisition cost
(1) Stocks .............................................................. ¥ 48,160 ¥104,559 ¥56,399
(2) Bonds .............................................................. 3,000 3,015 15
(3) Others .............................................................. 89,570 91,298 1,727
Sub Total ¥140,731 ¥198,873 ¥58,142
Those whose amount for BS does not exceed acquisition cost
(1) Stocks ............................................................. ¥ 999 ¥ 996 ¥ (3)
(2) Bonds ............................................................. 15,000 14,991 (8)
(3) Others ............................................................. —— —
Sub Total ¥ 15,999 ¥ 15,987 ¥ (12)
Total ¥156,731 ¥214,860 ¥58,129
Acquisition
Cost Amounts for
BS
Valuation
Those whose amount for BS exceeds acquisition cost
(1) Stocks ............................................................. ¥19,647 ¥ 82,522 ¥62,874
(2) Bonds ............................................................. 3,000 3,017 17
(3) Others ............................................................. 51,846 52,523 676
Sub Total ¥74,494 ¥138,063 ¥63,569
Those whose amount for BS does not exceed acquisition cost
(1) Stocks ............................................................. — — —
(2) Bonds ............................................................. ¥15,000 ¥ 14,992 ¥
(7)
(3) Others ............................................................. — — —
Sub Total ¥15,000 ¥ 14,992 ¥
(7)
Total ¥89,494 ¥153,056 ¥63,562
Acquisition
Cost
Amounts for
BS
Valuation
Thousands of U.S. dollars
Those whose amount for BS exceeds acquisition cost
(1) Stocks ............................................................. $ 407,966 $ 885,722 $477,756
(2) Bonds ............................................................. 25,412 25,542 129
(3) Others ............................................................. 758,752 773,390 14,637
Sub Total $1,192,132 $1,684,655 $492,523
Those whose amount for BS does not exceed acquisition cost
(1) Stocks ............................................................. $ 8,470 $ 8,437 $
(33)
(2) Bonds ............................................................. 127,064 126,989 (75)
(3) Others ............................................................. —— —
Sub Total $ 135,535 $ 135,427 $
(108)
Total $1,327,667 $1,820,082 $ 492,415
Acquisition
Cost Amounts for
BS
Valuation
2007
2006
2007
CONSOLIDATED FINANCIAL STATEMENTS OF 2007
38