Shutterfly 2009 Annual Report Download - page 56
Download and view the complete annual report
Please find page 56 of the 2009 Shutterfly annual report below. You can navigate through the pages in the report by either clicking on the pages listed below, or by using the keyword search tool below to find specific information within the annual report.-
 1
1 -
2
-
3
-
4
-
5
-
6
-
7
-
8
-
9
-
10
-
11
-
12
-
13
-
14
-
15
-
16
-
17
-
18
-
19
-
20
-
21
-
22
-
23
-
24
-
25
-
26
-
27
-
28
-
29
-
30
-
31
-
32
-
33
-
34
-
35
-
36
-
37
-
38
-
39
-
40
-
41
-
42
-
43
-
44
-
45
-
 46
46 -
 47
47 -
 48
48 -
 49
49 -
 50
50 -
 51
51 -
 52
52 -
 53
53 -
 54
54 -
 55
55 -
 56
56 -
 57
57 -
 58
58 -
 59
59 -
 60
60 -
 61
61 -
 62
62 -
 63
63 -
 64
64 -
 65
65 -
 66
66 -
67
-
68
-
69
-
70
-
71
-
72
-
73
-
74
-
75
-
76
-
77
-
78
-
79
-
80
-
81
-
82
-
83
-
84
-
85
-
86
-
87
-
88
-
89
-
90
-
91
-
92
-
93
-
94
-
95
-
96
-
97
-
98
-
99
-
100
-
101
-
102
-
103
-
104
-
105
-
106
-
107
-
108
-
109
-
110
-
111
-
112
-
113
-
114
-
115
-
116
-
117
-
118
-
119
-
120
-
121
-
122
-
123
-
124
-
125
-
126
-
127
-
128
-
129
-
130
-
131
 |
 |

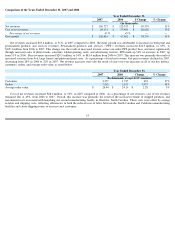
Our technology and development expense increased $9.5 million, or 50%, in 2007 compared to 2006. As a percentage of net revenues,
technology and development expense remained flat at 15% from 2006 to 2007. The overall increase in technology and development expense
was attributable to increased personnel and related costs for employees and consultants involved with website development and website
infrastructure support teams, which totaled $3.2 million, as well as increased third-
party hosting expenses which increased by $0.8 million. We
also continued to invest in our website infrastructure hardware to support our continued revenue growth, which resulted in increased depreciation
expense of $3.7 million. Stock-
based compensation expense was $0.9 million in 2007, compared to $0.7 million in 2006. In 2007, we
capitalized $3.1 million in eligible costs associated with software developed or obtained for internal use, up from $1.3 million in 2006.
Our sales and marketing expense increased $11.4 million, or 52%, in 2007 compared to 2006. Also as a percentage of net revenues, total
sales and marketing expense remained flat at 18% from 2006 to 2007. For 2007, personnel and related costs for employees and consultants
increased by $2.5 million, and our expenditures incurred on customer acquisition and promotion costs increased by $8.2 million. In addition,
stock-based compensation expense was $0.9 million in 2007, compared to $0.5 million in 2006.
Our general and administrative expense increased $10.3 million, or 54%, in 2007 compared to 2006, and remained flat as a percentage of net
revenues at 16% in that same period. Personnel and related costs increased by $3.3 million in 2007 reflecting increased hiring in 2007 and an
increase in stock-
based compensation to $2.1 million, in 2007, compared to $0.9 million in 2006. Accounting and legal fees increased by
$1.2 million in 2007, and consulting expenses increased by $2.2 million. Of that combined increase of $3.4 million, approximately $2.2 million
was associated with our efforts to comply with the Sarbanes-
Oxley Act of 2002. Additionally, rent and related facilities charges increased by
$0.8 million for 2007 reflecting our additional square footage in Redwood City. Payment processing fees paid to third parties increased by
$1.5 million during 2007 due to increased order volumes. In 2006, we made a non-recourse, non-
refundable contribution of 65,000 shares of
common stock to Silicon Valley Community Foundation, a California non-
profit public benefit corporation, in order to establish the Shutterfly
Foundation as a corporate-
advised charitable fund within the Community Foundation, and recognized $0.9 million of charitable contribution
expense for 2006. We had no charitable contribution expense in 2007.
Year Ended December 31,
2007
2006
$ Change
% Change
(In thousands)
Technology and development
$
28,635
$
19,087
$
9,548
50
%
Percentage of net revenues
15
%
15
%
—
—
Sales and marketing
$
33,363
$
21,940
$
11,423
52
%
Percentage of net revenues
18
%
18
%
—
—
General and administrative
$
29,557
$
19,216
$
10,341
54
%
Percentage of net revenues
16
%
16
%
—
—
54