Shutterfly 2009 Annual Report Download - page 52
Download and view the complete annual report
Please find page 52 of the 2009 Shutterfly annual report below. You can navigate through the pages in the report by either clicking on the pages listed below, or by using the keyword search tool below to find specific information within the annual report.-
 1
1 -
2
-
3
-
4
-
5
-
6
-
7
-
8
-
9
-
10
-
11
-
12
-
13
-
14
-
15
-
16
-
17
-
18
-
19
-
20
-
21
-
22
-
23
-
24
-
25
-
26
-
27
-
28
-
29
-
30
-
31
-
32
-
33
-
34
-
35
-
36
-
37
-
38
-
39
-
40
-
41
-
 42
42 -
 43
43 -
 44
44 -
 45
45 -
 46
46 -
 47
47 -
 48
48 -
 49
49 -
 50
50 -
 51
51 -
 52
52 -
 53
53 -
 54
54 -
 55
55 -
 56
56 -
 57
57 -
 58
58 -
 59
59 -
 60
60 -
 61
61 -
 62
62 -
63
-
64
-
65
-
66
-
67
-
68
-
69
-
70
-
71
-
72
-
73
-
74
-
75
-
76
-
77
-
78
-
79
-
80
-
81
-
82
-
83
-
84
-
85
-
86
-
87
-
88
-
89
-
90
-
91
-
92
-
93
-
94
-
95
-
96
-
97
-
98
-
99
-
100
-
101
-
102
-
103
-
104
-
105
-
106
-
107
-
108
-
109
-
110
-
111
-
112
-
113
-
114
-
115
-
116
-
117
-
118
-
119
-
120
-
121
-
122
-
123
-
124
-
125
-
126
-
127
-
128
-
129
-
130
-
131
 |
 |
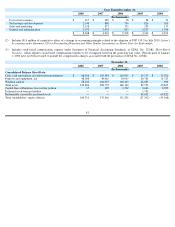
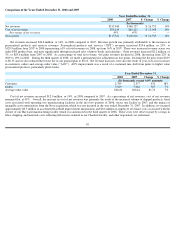
Comparison of the Years Ended December 31, 2008 and 2007
Net revenues increased $26.8 million, or 14%, in 2008 compared to 2007. Revenue growth was primarily attributable to the increases in
personalized products and services revenues. Personalized products and services (“PPS”)
revenues increased $24.6 million, or 23%, to
$129.9 million from 2007 to 2008 representing 61% of total revenues in 2008, up from 56% in 2007. There was increased revenue across our
entire PPS product base, and most significantly through increased sales of photo books and calendars. Print revenues increased $2.2 million, or
3%, to $83.6 million from 2007 to 2008. As a percentage of total net revenue, 4x6 print revenues declined in 2008, decreasing from 22% in
2007 to 19% in 2008.
During the third quarter of 2008, we made a permanent price adjustment on 4x6 prints, lowering the list price from $0.19
to $0.15 and we also reduced the lowest tier in our prepaid plan to $0.10. Net revenue increases were also the result of year-over-
year increases
in customers, orders and average order value (“AOV”).
AOV improvement was a result of a continued mix shift from prints to higher value
personalized products, particularly photo books.
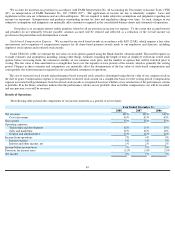
Cost of net revenues increased $12.0 million, or 14%, in 2008 compared to 2007. As a percentage of net revenues, cost of net revenues
remained flat, at 45%.
Overall, the increase in cost of net revenues was primarily the result of the increased volume of shipped products, fixed
costs associated with operating two manufacturing facilities in the first two quarters of 2008, versus one facility in 2007, and the impact of
intangible asset amortization from the Nexo acquisition which was not incurred in the year ended December 31, 2007. In addition, we incurred
approximately $0.5 million in accelerated leasehold improvement amortization and $0.6 million in employee severance costs associated with the
closure of our Hayward manufacturing facility which was announced in the third quarter of 2008. These costs were offset in part by savings in
labor, shipping, and materials costs reflecting efficiencies realized in our Charlotte facility, and other negotiated cost reductions.
Year Ended December 31,
2008
2007
$ Change
% Change
(In thousands)
Net revenues
$213,480
$186,727
$ 26,753
14%
Cost of net revenues
$96,159
$84,111
$ 12,048
14%
Percentage of net revenues
45%
45%
—
—
Gross profit
$117,321
$102,616
$ 14,705
14%
Year Ended December 31,
2008
2007
Change
% Change
(In thousands, except AOV amounts)
Customers
2,789
2,357
432
18%
Orders
7,569
7,062
507
7%
Average order value
$28.20
$26.44
$1.76
7%
50