Sallie Mae 2001 Annual Report Download - page 17
Download and view the complete annual report
Please find page 17 of the 2001 Sallie Mae annual report below. You can navigate through the pages in the report by either clicking on the pages listed below, or by using the keyword search tool below to find specific information within the annual report.-
 1
1 -
2
-
3
-
4
-
5
-
6
-
 7
7 -
 8
8 -
 9
9 -
 10
10 -
 11
11 -
 12
12 -
 13
13 -
 14
14 -
 15
15 -
 16
16 -
 17
17 -
 18
18 -
 19
19 -
 20
20 -
 21
21 -
 22
22 -
 23
23 -
 24
24
 |
 |

15
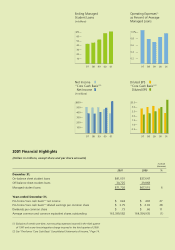
Selected Financial Data 1997–2001
(Dollars in millions, except per share amounts)
The following table sets forth selected financial and other operating information of the Company. The selected financial data in the table
is derived from the consolidated financial statements of the Company. The data should be read in conjunction with the consolidated
financial statements, related notes and “Management’s Discussion and Analysis of Financial Condition and Results of Operations”
included in the Company’s Form 10-K to the Securities and Exchange Commission.
2001 2000 1999 1998 1997
Operating Data:
Net interest income $ 873 $ 642 $ 694 $ 651 $ 781
Net income 384 465 501 501 508
Basic earnings per common share 2.34 2.84 3.11 2.99 2.80
Diluted earnings per common share 2.28 2.76 3.06 2.95 2.78
Dividends per common share .73 .66 .61 .57 .52
Return on common stockholders’ equity 30% 49% 78% 81% 65%
Net interest margin 1.82 1.52 1.85 1.93 1.80
Return on assets .78 1.06 1.28 1.41 1.12
Dividend payout ratio 32 24 20 19 19
Average equity/average assets 2.66 2.34 1.59 1.65 1.64
Balance Sheet Data:
Student loans $41,001 $37,647 $33,809 $28,283 $29,443
Total assets 52,874 48,792 44,025 37,210 39,832
Total borrowings 48,350 45,375 41,988 35,399 37,717
Stockholders’ equity 1,672 1,415 841 654 675
Book value per common share 9.69 7.62 4.29 3.98 3.89
Other Data:
Securitized student loans outstanding $30,725 $29,868 $19,467 $18,059 $14,262
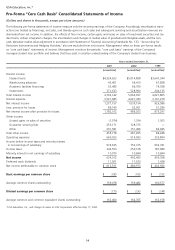
Pro-forma “Core Cash Basis” Results (unaudited)(1):
Net interest income $ 1,271 $ 1,039 $ 927 $ 892 $ 937
Net income 624 492 405 381 384
Diluted earnings per common share 3.75 2.93 2.48 2.24 2.10
Net interest margin 1.64% 1.53% 1.68% 1.76% 1.75%
Return on assets .79 .71 .71 .72 .70
(1) The pro-forma results measure only the recurring earnings of the Company. Accordingly, securitization transactions are treated as financings,
not sales, and thereby gains on such sales and subsequent servicing and securitization revenues are eliminated from net income. In addition,
the effects of floor income, certain gains and losses on sales of investment securities and student loans, certain integration charges, the amortization
and changes in market value of goodwill and intangible assets, and the non-cash, derivative market value adjustment in accordance with Statement
of Financial Accounting Standards No. 133, “Accounting for Derivative Instruments and Hedging Activities,” also are excluded from net income.
Management refers to these pro-forma results as “core cash basis” results. Management monitors the periodic “core cash basis” earnings of the
Company’s managed student loan portfolio and believes that they assist in a better understanding of the Company’s student loan business.
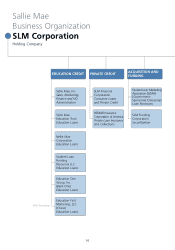
*USA Education, Inc., will change its name to SLM Corporation effective May 17, 2002.
USA Education, Inc.*