Sallie Mae 2001 Annual Report Download - page 13
Download and view the complete annual report
Please find page 13 of the 2001 Sallie Mae annual report below. You can navigate through the pages in the report by either clicking on the pages listed below, or by using the keyword search tool below to find specific information within the annual report.-
 1
1 -
2
-
 3
3 -
 4
4 -
 5
5 -
 6
6 -
 7
7 -
 8
8 -
 9
9 -
 10
10 -
 11
11 -
 12
12 -
 13
13 -
 14
14 -
 15
15 -
 16
16 -
 17
17 -
 18
18 -
 19
19 -
 20
20 -
 21
21 -
 22
22 -
 23
23 -
24
 |
 |
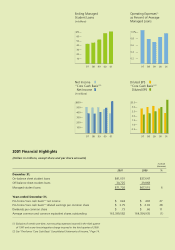
2001 Financial Highlights
(Dollars in millions, except share and per share amounts)
Increase
(decrease)
2001 2000 %
December 31,
On-balance sheet student loans $41,001 $37,647
Off-balance sheet student loans 30,725 29,868
_____________________________ _____________________________
Managed student loans $71,726 $67,515 6
_____________________________ _____________________________
_____________________________ _____________________________
_____________________________ _____________________________
Years ended December 31,
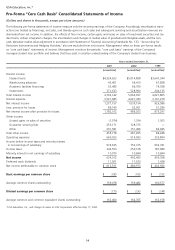
Pro-forma“core cash basis”(2) net income $ 624 $ 492 27
Pro-forma“core cash basis”(2) diluted earnings per common share $ 3.75 $ 2.93 28
Dividends per common share $ .73 $ .66 11
Average common and common equivalent shares outstanding 163,399,582 164,354,935 (1)
(1) Exclusive of certain one-time, non-recurring expenses incurred in the third quarter
of 1997 and a one-time integration charge incurred in the third quarter of 2000.
(2) See “Pro-forma ‘Core Cash Basis’ Consolidated Statements of Income,” Page 14.
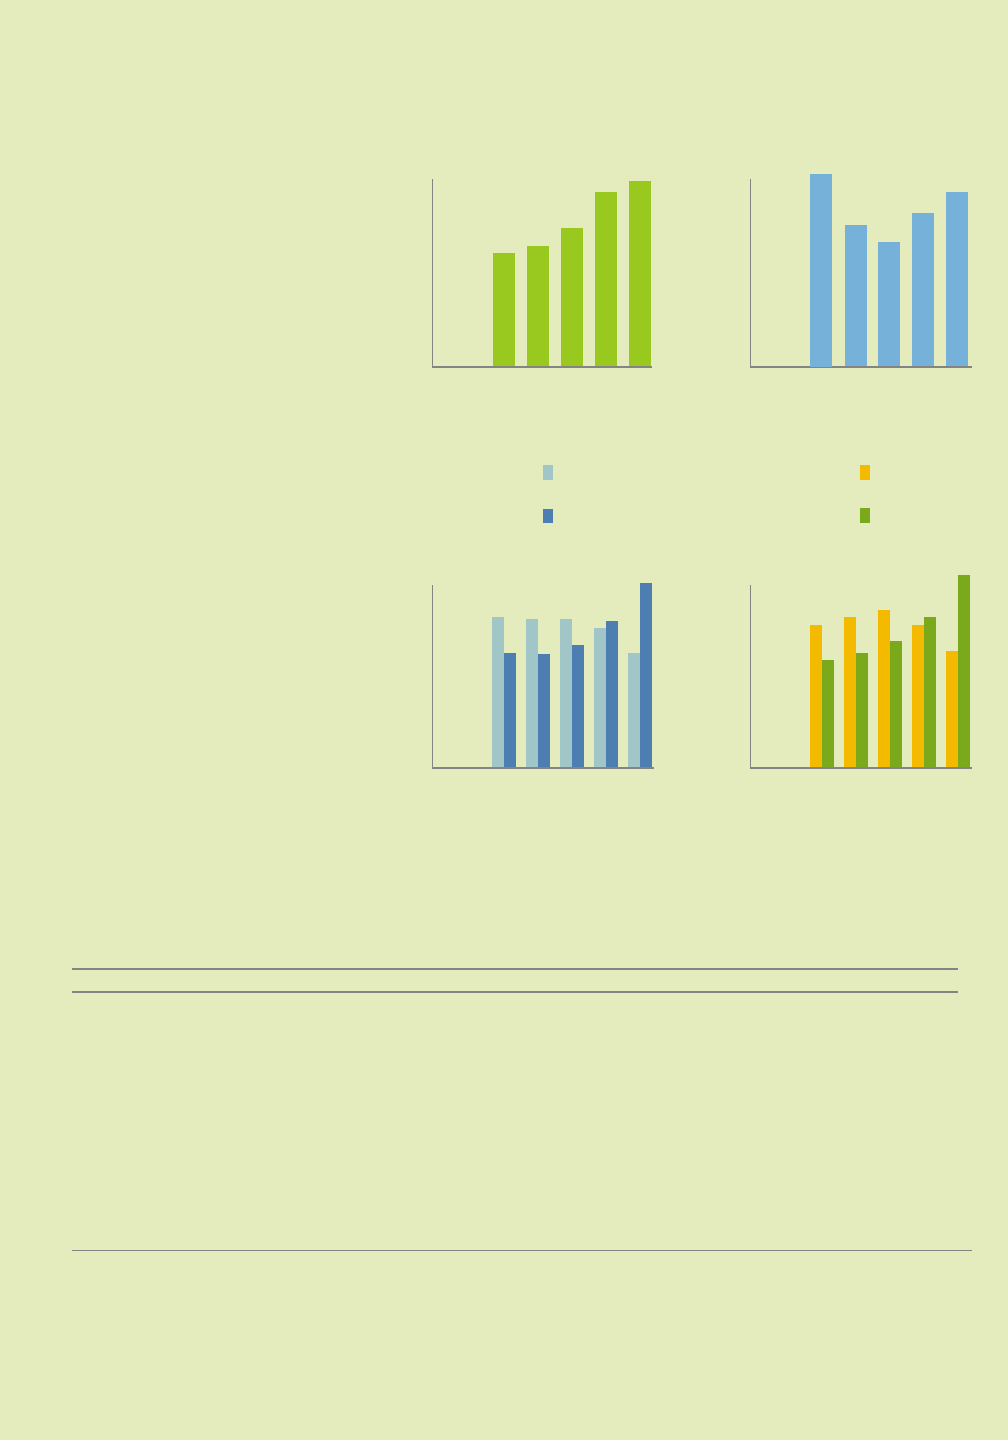
$3.5—
3.0—
2.5—
2.0—
1.5—
1.0—
0.5—
Diluted EPS
“Core Cash Basis”(2)
Diluted EPS
$600—
500—
400—
300—
200—
100—
Net Income
“Core Cash Basis”(2)
Net Income
(in millions)
$70—
60—
50—
40—
30—
20—
10—
Ending Managed
Student Loans
(in billions)
1.0%—
0.8 —
0.6 —
0.4 —
0.2 —
Operating Expenses(1)
as Percent of Average
Managed Loans
97 98 99 00 01 97 98 99 00 01
97 98 99 00 01 97 98 99 00 01