Sallie Mae 2001 Annual Report Download - page 15
Download and view the complete annual report
Please find page 15 of the 2001 Sallie Mae annual report below. You can navigate through the pages in the report by either clicking on the pages listed below, or by using the keyword search tool below to find specific information within the annual report.-
 1
1 -
2
-
3
-
4
-
 5
5 -
 6
6 -
 7
7 -
 8
8 -
 9
9 -
 10
10 -
 11
11 -
 12
12 -
 13
13 -
 14
14 -
 15
15 -
 16
16 -
 17
17 -
 18
18 -
 19
19 -
 20
20 -
 21
21 -
 22
22 -
 23
23 -
 24
24
 |
 |

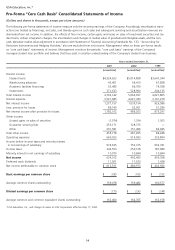
Consolidated Statements of Income
(Dollars and shares in thousands, except per share amounts)
Years ended December 31,
2001 2000 1999
Interest income:
Student loans $2,527,818 $2,854,231 $2,426,506
Warehousing advances 43,401 56,410 67,828
Academic facilities financings 53,485 66,709 74,358
Investments 372,827 501,309 239,883
_______________________________________ ______________________________________ ______________________________________
Total interest income 2,997,531 3,478,659 2,808,575
Interest expense 2,124,115 2,836,871 2,114,785
_______________________________________ ______________________________________ ______________________________________
Net interest income 873,416 641,788 693,790
Less: provision for losses 65,991 32,119 34,358
_______________________________________ ______________________________________ ______________________________________
Net interest income after provision for losses 807,425 609,669 659,432
_______________________________________ ______________________________________ ______________________________________
Other income:
Gains on student loan securitizations 75,199 91,846 35,280
Servicing and securitization revenue 634,320 295,646 288,584
(Losses) gains on sales of securities (178,287) 18,622 43,001
Guarantor servicing fees 255,171 128,375 —
Derivative market value adjustment (452,425) — —
Other 183,639 153,143 83,925
_______________________________________ ______________________________________ ______________________________________
Total other income 517,617 687,632 450,790
Operating expenses 707,654 532,710 358,570
Integration charge — 53,000 —
_______________________________________ ______________________________________ ______________________________________
Income before income taxes and minority interest
in net earnings of subsidiary 617,388 711,591 751,652
Income taxes 223,322 235,880 240,127
Minority interest in net earnings of subsidiary 10,070 10,694 10,694
_______________________________________ ______________________________________ ______________________________________
Net income 383,996 465,017 500,831
Preferred stock dividends 11,501 11,522 1,438
_______________________________________ ______________________________________ ______________________________________
Net income attributable to common stock $ 372,495 $ 453,495 $ 499,393
_______________________________________ ______________________________________ ______________________________________
_______________________________________ ______________________________________ ______________________________________
_______________________________________ ______________________________________ ______________________________________
Basic earnings per common share $ 2.34 $ 2.84 $ 3.11
_______________________________________ ______________________________________ ______________________________________
_______________________________________ ______________________________________ ______________________________________
_______________________________________ ______________________________________ ______________________________________
Average common shares outstanding 159,078 159,482 160,577
_______________________________________ ______________________________________ ______________________________________
_______________________________________ ______________________________________ ______________________________________
_______________________________________ ______________________________________ ______________________________________
Diluted earnings per common share $ 2.28 $ 2.76 $ 3.06
_______________________________________ ______________________________________ ______________________________________
_______________________________________ ______________________________________ ______________________________________
_______________________________________ ______________________________________ ______________________________________
Average common and common equivalent shares outstanding 163,400 164,355 163,158
_______________________________________ ______________________________________ ______________________________________
_______________________________________ ______________________________________ ______________________________________
_______________________________________ ______________________________________ ______________________________________
The financial statements should be read in conjunction with the financial statements and notes thereto included in the Company’s Form 10-K to the
Securities and Exchange Commission.
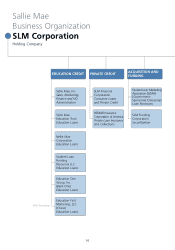
*USA Education, Inc., will change its name to SLM Corporation effective May 17, 2002.
13
USA Education, Inc.*