Sallie Mae 2001 Annual Report Download - page 16
Download and view the complete annual report
Please find page 16 of the 2001 Sallie Mae annual report below. You can navigate through the pages in the report by either clicking on the pages listed below, or by using the keyword search tool below to find specific information within the annual report.-
 1
1 -
2
-
3
-
4
-
5
-
 6
6 -
 7
7 -
 8
8 -
 9
9 -
 10
10 -
 11
11 -
 12
12 -
 13
13 -
 14
14 -
 15
15 -
 16
16 -
 17
17 -
 18
18 -
 19
19 -
 20
20 -
 21
21 -
 22
22 -
 23
23 -
 24
24
 |
 |

14
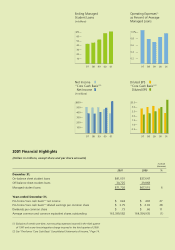
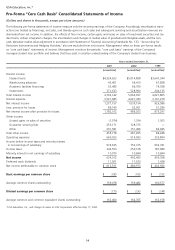
Pro-Forma “Core Cash Basis” Consolidated Statements of Income
(Dollars and shares in thousands, except per share amounts)
The following pro-forma statements of income measure only the recurring earnings of the Company. Accordingly, securitization trans-
actions are treated as financings, not sales, and thereby gains on such sales and subsequent servicing and securitization revenues are
eliminated from net income. In addition, the effects of floor income, certain gains and losses on sales of investment securities and stu-
dent loans, certain integration charges, the amortization and changes in market value of goodwill and intangible assets, and the non-
cash, derivative market value adjustment in accordance with Statement of Financial Accounting Standards No. 133, “Accounting for
Derivative Instruments and Hedging Activities,” also are excluded from net income. Management refers to these pro-forma results
as “core cash basis” statements of income. Management monitors the periodic “core cash basis” earnings of the Company’s
managed student loan portfolio and believes that they assist in a better understanding of the Company’s student loan business.
Years ended December 31,
2001 2000 1999
(unaudited) (unaudited) (unaudited)
Interest income:
Student loans $4,324,623 $5,014,858 $3,641,544
Warehousing advances 43,401 56,410 67,828
Academic facilities financings 53,485 66,709 74,358
Investments 371,633 528,960 244,135
_______________________________________ _______________________________________ _______________________________________
Total interest income 4,793,142 5,666,937 4,027,865
Interest expense 3,521,985 4,627,783 3,101,279
_______________________________________ _______________________________________ _______________________________________
Net interest income 1,271,157 1,039,154 926,586
Less: provision for losses 89,145 52,951 51,289
_______________________________________ _______________________________________ _______________________________________
Net interest income after provision for losses 1,182,012 986,203 875,297
_______________________________________ _______________________________________ _______________________________________
Other income:
(Losses) gains on sales of securities (1,574) 1,334 1,303
Guarantor servicing fees 255,171 128,375 —
Other 201,581 151,496 82,945
_______________________________________ _______________________________________ _______________________________________
Total other income 455,178 281,205 84,248
Operating expenses 660,555 514,093 355,804
_______________________________________ _______________________________________ _______________________________________
Income before income taxes and minority interest
in net earnings of subsidiary 976,635 753,315 603,741
Income taxes 342,553 250,128 187,689
Minority interest in net earnings of subsidiary 10,070 10,694 10,694
_______________________________________ _______________________________________ _______________________________________
Net income 624,012 492,493 405,358
Preferred stock dividends 11,501 11,520 1,438
_______________________________________ _______________________________________ _______________________________________
Net income attributable to common stock $ 612,511 $ 480,973 $ 403,920
_______________________________________ _______________________________________ _______________________________________
_______________________________________ _______________________________________ _______________________________________
_______________________________________ _______________________________________ _______________________________________
Basic earnings per common share $ 3.85 $ 3.02 $ 2.52
_______________________________________ _______________________________________ _______________________________________
_______________________________________ _______________________________________ _______________________________________
_______________________________________ _______________________________________ _______________________________________
Average common shares outstanding 159,078 159,482 160,577
_______________________________________ _______________________________________ _______________________________________
_______________________________________ _______________________________________ _______________________________________
_______________________________________ _______________________________________ _______________________________________
Diluted earnings per common share $ 3.75 $ 2.93 $ 2.48
_______________________________________ _______________________________________ _______________________________________
_______________________________________ _______________________________________ _______________________________________
_______________________________________ _______________________________________ _______________________________________
Average common and common equivalent shares outstanding 163,400 164,355 163,158
_______________________________________ _______________________________________ _______________________________________
_______________________________________ _______________________________________ _______________________________________
_______________________________________ _______________________________________ _______________________________________
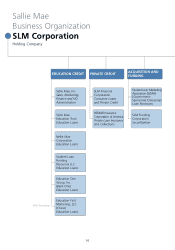
*USA Education, Inc., will change its name to SLM Corporation effective May 17, 2002.
USA Education, Inc.*