Red Lobster 2008 Annual Report Download - page 80
Download and view the complete annual report
Please find page 80 of the 2008 Red Lobster annual report below. You can navigate through the pages in the report by either clicking on the pages listed below, or by using the keyword search tool below to find specific information within the annual report.-
 1
1 -
2
-
3
-
4
-
5
-
6
-
7
-
8
-
9
-
10
-
11
-
12
-
13
-
14
-
15
-
16
-
17
-
18
-
19
-
20
-
21
-
22
-
23
-
24
-
25
-
26
-
27
-
28
-
29
-
30
-
31
-
32
-
33
-
34
-
35
-
36
-
37
-
38
-
39
-
40
-
41
-
42
-
43
-
44
-
45
-
46
-
47
-
48
-
49
-
50
-
51
-
52
-
53
-
54
-
55
-
56
-
57
-
58
-
59
-
60
-
61
-
62
-
63
-
64
-
65
-
66
-
67
-
68
-
69
-
 70
70 -
 71
71 -
 72
72 -
 73
73 -
 74
74 -
 75
75 -
 76
76 -
 77
77 -
 78
78 -
 79
79 -
 80
80 -
 81
81 -
 82
82
 |
 |

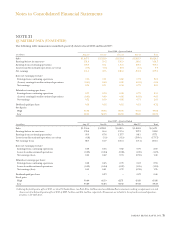
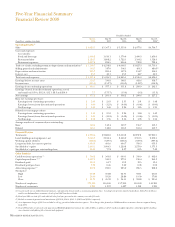
76 DARDEN RESTAURANTS, INC.
Fiscal Year Ended
May 25, May 27, May 28, May 29, May 30,
(In millions, except per share data) 2008 2007 2006 2005 2004
(2)
Operating Results (1)
Sales $ 6,626.5 $ 5,567.1 $ 5,353.6 $ 4,977.6 $ 4,794.7
Costs and expenses:
Cost of sales:
Food and beverage 1,996.2 1,616.1 1,570.0 1,490.3 1,456.9
Restaurant labor 2,124.7 1,808.2 1,722.1 1,594.2 1,528.6
Restaurant expenses 1,017.8 834.5 806.4 742.8 728.4
Total cost of sales, excluding restaurant depreciation and amortization(3) $ 5,138.7 $ 4,258.8 $ 4,098.5 $ 3,827.3 $ 3,713.9
Selling, general and administrative 641.7 537.0 506.1 469.3 480.3(4)
Depreciation and amortization 245.7 200.4 197.0 194.7 196.9
Interest, net 85.7 40.1 43.9 44.7 44.9
Total costs and expenses $ 6,111.8 $ 5,036.3 $ 4,845.5 $ 4,536.0 $ 4,436.0
Earnings before income taxes 514.7 530.8 508.1 441.6 358.7
Income taxes (145.2) (153.7) (156.3) (141.7) (116.2)
Earnings from continuing operations $ 369.5 $ 377.1 $ 351.8 $ 299.9 $ 242.5
Earnings (losses) from discontinued operations, net of
tax benefit of $(3.0), $112.9, $12.1, $8.3 and $10.6 7.7 (175.7) (13.6) (9.3) (15.3)
Net earnings $ 377.2 $ 201.4 $ 338.2 $ 290.6 $ 227.2
Basic net earnings per share:
Earnings from continuing operations $ 2.63 $ 2.63 $ 2.35 $ 1.91 $ 1.48
Earnings (losses) from discontinued operations $ 0.06 $ (1.23) $ (0.09) $ (0.06) $ (0.09)
Net Earnings $ 2.69 $ 1.40 $ 2.26 $ 1.85 $ 1.39
Diluted net earnings per share:
Earnings from continuing operations $ 2.55 $ 2.53 $ 2.24 $ 1.84 $ 1.43
Earnings (losses) from discontinued operations $ 0.05 $ (1.18) $ (0.08) $ (0.06) $ (0.09)
Net Earnings $ 2.60 $ 1.35 $ 2.16 $ 1.78 $ 1.34
Average number of common shares outstanding:
Basic 140.4 143.4 149.7 156.7 163.5
Diluted 145.1 148.8 156.9 163.4 169.7
Financial Position
Total assets $ 4,730.6 $ 2,880.8 $ 3,010.2 $2,937.8 $2,780.3
Land, buildings and equipment, net 3,066.0 2,184.4 2,446.0 2,351.5 2,250.6
Working capital (deficit) (668.3) (529.0) (648.5) (637.3) (337.2)
Long-term debt, less current portion 1,634.3 491.6 494.7 350.3 653.3
Stockholders’ equity 1,409.1 1,094.5 1,229.8 1,273.0 1,175.3
Stockholders’ equity per outstanding share 10.03 7.74 8.37 8.25 7.42
Other Statistics
Cash flows from operations (1) $ 766.8 $ 569.8 $ 699.1 $ 550.0 $ 492.0
Capital expenditures (1) (5) 1,627.3 345.2 273.5 210.4 269.3
Dividends paid 100.9 65.7 59.2 12.5 13.0
Dividends paid per share 0.72 0.46 0.40 0.08 0.08
Advertising expense (1) 257.8 230.0 223.0 206.5 208.8
Stock price:
High 47.08 45.88 42.75 33.11 25.60
Low 20.99 33.29 28.80 19.30 17.80
Close $ 31.74 $ 45.32 $ 36.51 $ 32.80 $ 22.50
Number of employees 178,200 156,500 157,300 150,100 141,300
Number of restaurants 1,702 1,397 1,427 1,381 1,325
(1) Consistent with our consolidated financial statements, information has been presented on a continuing operations basis. Accordingly, the activities related to Smokey Bones, Rocky River Grillhouse
and the nine Bahama Breeze restaurants closed in fiscal 2007 have been excluded.
(2) Fiscal year 2004 consisted of 53 weeks while all other fiscal years presented on this summary consisted of 52 weeks.
(3) Excludes restaurant depreciation and amortization of $230.0, $186.4, $181.1, $180.2 and $182.6, respectively.
(4) Asset impairment charges of $28.1 are included in selling, general and administrative expenses. These charges relate primarily to 10 Bahama Breeze restaurants that were impaired during
fiscal 2004.
(5) Fiscal 2008 includes net cash used in the acquisition of RARE Hospitality International, Inc. of $1.20 billion in addition to $429.2 million of capital expenditures related principally to building
new restaurants and replacing old restaurants and equipment.
Five-Year Financial Summary
Financial Review 2008