Red Lobster 2008 Annual Report Download - page 41
Download and view the complete annual report
Please find page 41 of the 2008 Red Lobster annual report below. You can navigate through the pages in the report by either clicking on the pages listed below, or by using the keyword search tool below to find specific information within the annual report.-
 1
1 -
2
-
3
-
4
-
5
-
6
-
7
-
8
-
9
-
10
-
11
-
12
-
13
-
14
-
15
-
16
-
17
-
18
-
19
-
20
-
21
-
22
-
23
-
24
-
25
-
26
-
27
-
28
-
29
-
30
-
 31
31 -
 32
32 -
 33
33 -
 34
34 -
 35
35 -
 36
36 -
 37
37 -
 38
38 -
 39
39 -
 40
40 -
 41
41 -
 42
42 -
 43
43 -
 44
44 -
 45
45 -
 46
46 -
 47
47 -
 48
48 -
 49
49 -
 50
50 -
 51
51 -
52
-
53
-
54
-
55
-
56
-
57
-
58
-
59
-
60
-
61
-
62
-
63
-
64
-
65
-
66
-
67
-
68
-
69
-
70
-
71
-
72
-
73
-
74
-
75
-
76
-
77
-
78
-
79
-
80
-
81
-
82
 |
 |

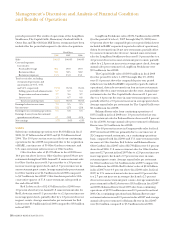
DARDEN RESTAURANTS, INC. 37
Management’s Discussion and Analysis of Financial Condition
and Results of Operations
Our fixed-charge coverage ratio, which measures the
number of times each year that we earn enough to cover our
fixed charges, amounted to 5.1 times and 8.6 times, on a con-
tinuing operations basis, for the fiscal years ended May 25, 2008
and May 27, 2007, respectively. Our adjusted debt to adjusted
total capital ratio (which includes 6.25 times the total annual
minimum rent of $102.0 million and $64.3 million for the
fiscal years ended May 25, 2008 and May 27, 2007, respectively,
as components of adjusted debt and adjusted total capital) was
64 percent and 50 percent at May 25, 2008 and May 27, 2007,
respectively. We use the lease-debt equivalent in our adjusted
debt to adjusted total capital ratio reported to shareholders,
as we believe its inclusion better represents the optimal capital
structure that we target from period to period.
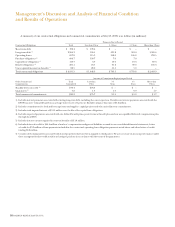
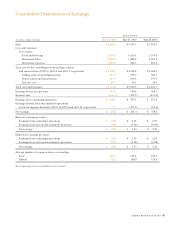
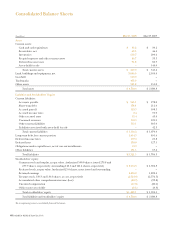
Based on these ratios, we believe our financial condition
is strong. The composition of our capital structure is shown in
the following table.
(In millions, except ratios)
May 25, 2008 May 27, 2007
Capital Structure
Short-term debt $ 178.4 $ 211.4
Long-term debt 1,640.5 494.1
Capital lease obligations 60.8 --
Stockholders’ equity 1,409.1 1,094.5
Total capital $ 3,288.8 $ 1,800.0
Adjustments to Capital
Short-term debt $ 178.4 $ 211.4
Long-term debt 1,640.5 494.1
Capital lease obligations 60.8 --
Lease-debt equivalent 637.5 397.0
Adjusted debt $ 2,517.2 $ 1,102.5
Stockholders’ equity 1,409.1 1,094.5
Adjusted total capital $ 3,926.3 $ 2,197.0
Capital Structure Ratios
Debt to total capital ratio 57% 39%
Adjusted debt to adjusted
total capital ratio 64% 50%
Net cash flows provided by operating activities from
continuing operations were $766.8 million, $569.8 million and
$699.1 million in fiscal 2008, 2007 and 2006, respectively. Net
cash flows provided by operating activities include net earnings
from continuing operations of $369.5 million, $377.1 million
and $351.8 million in fiscal 2008, 2007 and 2006, respectively.
Net cash flows provided by operating activities from continuing
operations increased in fiscal 2008 primarily as a result of
the timing of purchases of inventories and restaurant level
services. Net cash flows provided by operating activities also
reflect income tax payments of $119.7 million, $75.9 million
and $126.3 million in fiscal 2008, 2007 and 2006, respectively.
The lower tax payments in fiscal 2007, as compared with tax
payments in fiscal 2008 and fiscal 2006, primarily relate to
lower taxable income in fiscal 2007 caused by the closing of
the 54 Smokey Bones, two Rocky River Grillhouse and nine
Bahama Breeze restaurants.
Net cash flows used in investing activities from continuing
operations were $1.62 billion, $289.5 million and $258.3 million
in fiscal 2008, 2007 and 2006, respectively. Net cash flows used
in investing activities included capital expenditures incurred
principally to acquire RARE, build new restaurants, replace
equipment and remodel existing restaurants. Capital expen-
ditures related to continuing operations were $429.2 million
in fiscal 2008, compared to $345.2 million in fiscal 2007 and
$273.5 million in fiscal 2006. In addition to the acquisition
of RARE, the increased expenditures in fiscal 2008 and 2007
resulted primarily from increased spending associated with
building more new restaurants and replacement of restaurant
equipment. During fiscal 2007, we also received $45.2 million
in cash from the sale and leaseback of our current restaurant
support center. We estimate that our fiscal 2009 capital expendi-
tures will approximate $600 million, including approximately
$85 million on our new restaurant support center. The overall
cost of our new restaurant support center will be largely offset
by various state and local tax credits and incentives and cash
proceeds received from the sale of our current restaurant
support center.
Net cash flows provided by (used in) financing activities
from continuing operations were $805.5 million, ($322.9)
million and ($392.9) million in fiscal 2008, 2007 and 2006,
respectively. During fiscal 2008 we completed the offering of
$1.15 billion of New Senior Notes, resulting in net proceeds
of $1.13 billion, which were used to repay borrowings under
the Interim Credit Agreement, which funded the acquisition
of RARE. Proceeds received from the New Revolving Credit
Agreement were used to partially fund the acquisition of
RARE and to repay the $125.0 million 2.5 percent convertible
notes assumed from RARE. Net cash flows used in financing
activities also included our repurchase of 5.0 million shares of
our common stock for $159.4 million in fiscal 2008 compared
with 9.4 million shares of our common stock for $371.2 million
in fiscal 2007 and 11.9 million shares for $434.2 million in fiscal
2006. As of May 25, 2008, our Board of Directors had authorized
us to repurchase up to 162.4 million shares of our common
stock and a total of 147.0 million shares had been repurchased
under the authorization. The repurchased common stock is
reflected as a reduction of stockholders’ equity. As of May 25,
2008, our unused authorization was 15.4 million shares. During
fiscal 2006 we completed the offering of $300.0 million in senior