Red Lobster 2008 Annual Report Download - page 33
Download and view the complete annual report
Please find page 33 of the 2008 Red Lobster annual report below. You can navigate through the pages in the report by either clicking on the pages listed below, or by using the keyword search tool below to find specific information within the annual report.-
 1
1 -
2
-
3
-
4
-
5
-
6
-
7
-
8
-
9
-
10
-
11
-
12
-
13
-
14
-
15
-
16
-
17
-
18
-
19
-
20
-
21
-
22
-
 23
23 -
 24
24 -
 25
25 -
 26
26 -
 27
27 -
 28
28 -
 29
29 -
 30
30 -
 31
31 -
 32
32 -
 33
33 -
 34
34 -
 35
35 -
 36
36 -
 37
37 -
 38
38 -
 39
39 -
 40
40 -
 41
41 -
 42
42 -
 43
43 -
44
-
45
-
46
-
47
-
48
-
49
-
50
-
51
-
52
-
53
-
54
-
55
-
56
-
57
-
58
-
59
-
60
-
61
-
62
-
63
-
64
-
65
-
66
-
67
-
68
-
69
-
70
-
71
-
72
-
73
-
74
-
75
-
76
-
77
-
78
-
79
-
80
-
81
-
82
 |
 |
DARDEN RESTAURANTS, INC. 29
Management’s Discussion and Analysis of Financial Condition
and Results of Operations
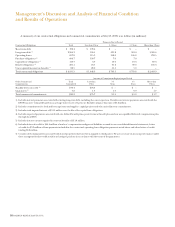
COSTS AND EXPENSES
Total costs and expenses from continuing operations were
$6.11 billion in fiscal 2008, $5.04 billion in fiscal 2007 and
$4.85 billion in fiscal 2006. As a percent of sales, total costs
and expenses from continuing operations in fiscal 2008 were
92.2 percent, an increase from 90.5 percent in both fiscal
2007 and fiscal 2006.
Food and beverage costs increased $380.1 million, or
23.5 percent, from $1.62 billion in fiscal 2007 to $2.00 billion
in fiscal 2008. Food and beverage costs increased $46.1 million,
or 2.9 percent, from $1.57 billion in fiscal 2006 to $1.62 billion
in fiscal 2007. As a percent of sales, food and beverage costs
increased from fiscal 2007 to fiscal 2008 primarily as a result
of the acquisition of RARE, whose concepts have historically
had higher food and beverage costs, as a percent of sales,
compared to our consolidated average prior to the acquisition.
As a percent of sales, food and beverage costs also increased as
a result of an increase in food costs, such as dairy, wheat, non-
perishables and seafood, partially offset by pricing increases.
As a percent of sales, food and beverage costs decreased from
fiscal 2006 to fiscal 2007 primarily as a result of favorable pricing
partially offset by menu mix changes. During fiscal 2007 food
and beverage costs, as a percent of sales, also decreased from
fiscal 2006 as a result of the larger contribution from Olive
Garden, which has historically had lower food and beverage
costs, to our overall sales and operating results.
Restaurant labor costs increased $316.5 million, or 17.5
percent, from $1.81 billion in fiscal 2007 to $2.12 billion in
fiscal 2008. Restaurant labor costs increased $86.1 million,
or 5.0 percent, from $1.72 billion in fiscal 2006 to $1.81 billion
in fiscal 2007. As a percent of sales, restaurant labor costs
decreased in fiscal 2008 primarily as a result of the acquisition
of RARE, whose concepts have historically had lower restaurant
labor costs, as a percent of sales, compared to our consolidated
average prior to the acquisition, as well as sales growth leverag-
ing. As a percent of sales, this decrease in restaurant labor costs
was partially offset by an increase in wage rates, benefit costs
and manager compensation. As a percent of sales, restaurant
labor costs increased in fiscal 2007 from fiscal 2006 primarily
as a result of an increase in wage rates and an increase in FICA
taxes on higher reported tips, which was partially offset by the
favorable impact of higher sales volumes. The increase in
FICA tax expense on higher reported tips is fully offset at the
consolidated net earnings from continuing operations level
by a corresponding income tax credit, which reduces income
tax expense.
Restaurant expenses (which include lease, property tax,
credit card, utility, workers’ compensation, insurance, new
restaurant pre-opening and other restaurant-level operating
expenses) increased $183.3 million, or 22.0 percent, from
$834.5 million in fiscal 2007 to $1.02 billion in fiscal 2008.
Restaurant expenses increased $28.1 million, or 3.5 percent,
from $806.4 million in fiscal 2006 to $834.5 million in fiscal
2007. As a percent of sales, restaurant expenses increased in
fiscal 2008 as compared to fiscal 2007 primarily as a result of
RARE’s higher restaurant expenses as a percentage of sales
compared to our consolidated average prior to the acquisition
and integration costs and purchase accounting adjustments
related to the RARE acquisition, partially offset by increased
sales growth leveraging. As a percent of sales, restaurant expenses
decreased in fiscal 2007 as compared with fiscal 2006 as a result
of the favorable impact of higher sales volumes and decreases
in our insurance and workers’ compensation expenses.
Selling, general and administrative expenses increased
$104.7 million, or 19.5 percent, from $537.0 million in fiscal
2007 to $641.7 million in fiscal 2008. Selling, general and
administrative expenses increased $30.9 million, or 6.1 percent,
from $506.1 million in fiscal 2006 to $537.0 million in fiscal
2007. As a percent of sales, selling, general and administrative
expenses were consistent from fiscal 2007 to fiscal 2008
primarily as a result of transaction and integration-related
costs and purchase accounting adjustments related to the
RARE acquisition and increased legal costs, which were offset
by increased sales growth leveraging. As a percent of sales,
selling, general and administrative expenses increased in
fiscal 2007 as compared with fiscal 2006 primarily as a result of
the recognition of stock-based compensation expense due to
the adoption of Statement of Financial Accounting Standards
(SFAS) No. 123R, “Share-Based Payment,” in fiscal 2007 and
increased marketing expenses, partially offset by the favorable
impact of higher sales volumes and a decrease in litigation
related costs.
Depreciation and amortization expense increased
$45.3 million, or 22.6 percent, from $200.4 million in fiscal
2007 to $245.7 million in fiscal 2008. Depreciation and
amortization expense increased $3.4 million, or 1.7 percent,
from $197.0 million in fiscal 2006 to $200.4 million in fiscal
2007. As a percent of sales, depreciation and amortization
expense increased in fiscal 2008 as a result of new restaurant
activity, including the acquisition of RARE, which was partially
offset by increased sales growth leveraging. As a percent of sales,
depreciation and amortization declined from fiscal 2006 to
fiscal 2007 primarily as a result of the continued use of fully
depreciated, well-maintained equipment and the favorable
impact of higher sales volumes, which were only partially
offset by new restaurant and remodel activities.
Net interest expense increased $45.6 million or 113.7 percent
from $40.1 million in fiscal 2007 to $85.7 million in fiscal 2008.
Net interest expense decreased $3.8 million, or 8.7 percent,
from $43.9 million in fiscal 2006 to $40.1 million in fiscal 2007.
As a percent of sales, net interest expense increased in fiscal
2008 compared to fiscal 2007 due mainly to an increase in