Red Lobster 2008 Annual Report Download - page 31
Download and view the complete annual report
Please find page 31 of the 2008 Red Lobster annual report below. You can navigate through the pages in the report by either clicking on the pages listed below, or by using the keyword search tool below to find specific information within the annual report.-
 1
1 -
2
-
3
-
4
-
5
-
6
-
7
-
8
-
9
-
10
-
11
-
12
-
13
-
14
-
15
-
16
-
17
-
18
-
19
-
20
-
 21
21 -
 22
22 -
 23
23 -
 24
24 -
 25
25 -
 26
26 -
 27
27 -
 28
28 -
 29
29 -
 30
30 -
 31
31 -
 32
32 -
 33
33 -
 34
34 -
 35
35 -
 36
36 -
 37
37 -
 38
38 -
 39
39 -
 40
40 -
 41
41 -
42
-
43
-
44
-
45
-
46
-
47
-
48
-
49
-
50
-
51
-
52
-
53
-
54
-
55
-
56
-
57
-
58
-
59
-
60
-
61
-
62
-
63
-
64
-
65
-
66
-
67
-
68
-
69
-
70
-
71
-
72
-
73
-
74
-
75
-
76
-
77
-
78
-
79
-
80
-
81
-
82
 |
 |
DARDEN RESTAURANTS, INC. 27
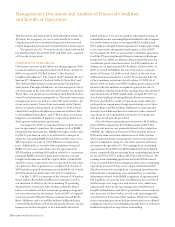
Management’s Discussion and Analysis of Financial Condition
and Results of Operations
Our net earnings (losses) from discontinued operations
were $7.7 million and ($175.7) million for fiscal 2008 and 2007,
respectively. Our diluted net earnings (losses) per share from
discontinued operations were $0.05 and ($1.18) for fiscal 2008
and 2007, respectively. The gain on the sale of Smokey Bones
contributed approximately $0.08 to diluted net earnings per
share from discontinued operations in fiscal 2008. When
combined with results from continuing operations, our diluted
net earnings per share were $2.60 and $1.35 for fiscal 2008
and 2007, respectively.
In fiscal 2009, we expect a net increase of approximately
75 to 80 restaurants. We expect combined U.S. same-restaurant
sales growth in fiscal 2009 of approximately 2 percent for Red
Lobster, Olive Garden and LongHorn Steakhouse. We expect
total sales growth of between 14 percent and 15 percent compared
to sales from continuing operations of $6.63 billion in fiscal
2008. This sales growth includes the impact of a 53rd week
in fiscal 2009, which we estimate will be 2 percentage points.
Diluted net earnings per share growth from continuing opera-
tions is expected to be between 14 percent and 15 percent
including the impact of the 53rd week of approximately two
percentage points. Transaction and integration-related costs
and purchase accounting adjustments are expected to favorably
impact diluted net earnings per share growth from fiscal 2008
to fiscal 2009 by approximately 5 percentage points.
In June 2008, we announced that we would pay a quarterly
dividend of 20 cents per share on August 1, 2008. Previously,
we had paid a quarterly dividend of 18 cents per share or
72 cents per share on an annual basis. Based on the 20 cent
quarterly dividend declaration, our indicated annual dividend
is 80 cents per share, an 11 percent increase.
Our mission is to be the best in full-service dining, now
and for generations. We believe we can achieve this goal
by continuing to build on our strategy to be a multi-brand
restaurant growth company, which is grounded in:
• Competitively superior leadership;
• Strong brand building that reflects brand management
and restaurant operating excellence; and
• Brand support excellence.
We seek to increase profits by leveraging our fixed and
semi-fixed costs with sales from new restaurants and increased
guest traffic and sales at existing restaurants. To evaluate our
operations and assess our financial performance, we monitor
a number of operating measures, with a special focus on two
key factors:
• Same-restaurant sales – which is a year-over-year
comparison of each period’s sales volumes for restaurants
open at least 16 months, including recently acquired
restaurants, absent consideration of when the restaurants
were acquired; and
• Restaurant earnings – which is restaurant-level
profitability (restaurant sales, less restaurant-level
cost of sales, marketing and depreciation).
Increasing same-restaurant sales can improve restaurant
earnings because these incremental sales provide better leverage
of our fixed and semi-fixed restaurant-level costs. A restaurant
concept can generate same-restaurant sales increases through
increases in guest traffic, increases in the average guest check,
or a combination of the two. The average guest check can
be impacted by menu price changes and by the mix of menu
items sold. For each restaurant concept, we gather daily sales
data and regularly analyze the guest traffic counts and the
mix of menu items sold to aid in developing menu pricing,
product offerings and promotional strategies. We view same-
restaurant guest counts as a measure of the long-term health
of a restaurant concept, while increases in average check and
menu mix may contribute more significantly to near-term
profitability. We focus on balancing our pricing and product
offerings with other initiatives to produce sustainable same-
restaurant sales growth.
We compute same-restaurant sales using restaurants open
at least 16 months because new restaurants experience a period
of time before sales levels normalize. Sales at newly opened
restaurants generally do not make a significant contribution to
profitability in their initial months of operation due to operating
inefficiencies. Our sales and expenses can be impacted significantly
by the number and timing of the opening of new restaurants
and the closing, relocation and remodeling of existing
restaurants. Pre-opening expenses each period reflect the
costs associated with opening new restaurants in current and
future periods.
There are significant risks and challenges that could
impact our operations and ability to increase sales and earn-
ings. The full-service dining restaurant industry is intensely
competitive and sensitive to economic cycles and other
business factors, including changes in consumer tastes and
dietary habits. Other risks and uncertainties are discussed in
Forward-Looking Statements found elsewhere in this report.
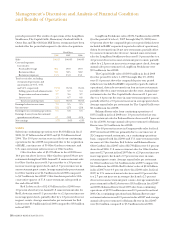
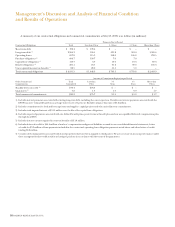
RESULTS OF OPERATIONS FOR
FISCAL 2008, 2007 AND 2006
The following table sets forth selected operating data as a
percentage of sales from continuing operations for the
52-week periods ended May 25, 2008, May 27, 2007 and May 28,
2006. This information is derived from the consolidated state-
ments of earnings, found elsewhere in this report. Additionally,
this information and the following analysis have been presented
with the results of operations, gains and losses on disposition,
impairment charges and closing costs for the Smokey Bones and
Rocky River Grillhouse restaurants and the nine closed Bahama
Breeze restaurants classified as discontinued operations for all