Prudential 2012 Annual Report Download - page 9
Download and view the complete annual report
Please find page 9 of the 2012 Prudential annual report below. You can navigate through the pages in the report by either clicking on the pages listed below, or by using the keyword search tool below to find specific information within the annual report.-
 1
1 -
 2
2 -
 3
3 -
 4
4 -
 5
5 -
 6
6 -
 7
7 -
 8
8 -
 9
9 -
 10
10 -
 11
11 -
 12
12 -
 13
13 -
 14
14 -
 15
15 -
 16
16 -
 17
17 -
 18
18 -
 19
19 -
 20
20 -
21
-
22
-
23
-
24
-
25
-
26
-
27
-
28
-
29
-
30
-
31
-
32
-
33
-
34
-
35
-
36
-
37
-
38
-
39
-
40
-
41
-
42
-
43
-
44
-
45
-
46
-
47
-
48
-
49
-
50
-
51
-
52
-
53
-
54
-
55
-
56
-
57
-
58
-
59
-
60
-
61
-
62
-
63
-
64
-
65
-
66
-
67
-
68
-
69
-
70
-
71
-
72
-
73
-
74
-
75
-
76
-
77
-
78
-
79
-
80
-
81
-
82
-
83
-
84
-
85
-
86
-
87
-
88
-
89
-
90
-
91
-
92
-
93
-
94
-
95
-
96
-
97
-
98
-
99
-
100
-
101
-
102
-
103
-
104
-
105
-
106
-
107
-
108
-
109
-
110
-
111
-
112
-
113
-
114
-
115
-
116
-
117
-
118
-
119
-
120
-
121
-
122
-
123
-
124
-
125
-
126
-
127
-
128
-
129
-
130
-
131
-
132
-
133
-
134
-
135
-
136
-
137
-
138
-
139
-
140
-
141
-
142
-
143
-
144
-
145
-
146
-
147
-
148
-
149
-
150
-
151
-
152
-
153
-
154
-
155
-
156
-
157
-
158
-
159
-
160
-
161
-
162
-
163
-
164
-
165
-
166
-
167
-
168
-
169
-
170
-
171
-
172
-
173
-
174
-
175
-
176
-
177
-
178
-
179
-
180
-
181
-
182
-
183
-
184
-
185
-
186
-
187
-
188
-
189
-
190
-
191
-
192
-
193
-
194
-
195
-
196
-
197
-
198
-
199
-
200
-
201
-
202
-
203
-
204
-
205
-
206
-
207
-
208
-
209
-
210
-
211
-
212
-
213
-
214
-
215
-
216
-
217
-
218
-
219
-
220
-
221
-
222
-
223
-
224
-
225
-
226
-
227
-
228
-
229
-
230
-
231
-
232
 |
 |

Prudential Financial, Inc. 2012 Annual Report 7
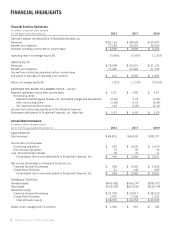
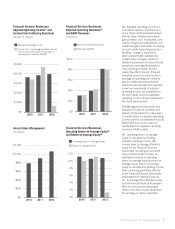
(A) Adjusted operating income is a
non-GAAP measure of performance
of our Financial Services Businesses
that excludes “Realized investment
gains (losses), net,” as adjusted, and
related charges and adjustments; net
investment gains and losses on trading
account assets supporting insurance
liabilities; change in experience-
rated contractholder liabilities due
to asset value changes; results of
divested businesses and discontinued
operations; earnings attributable to
noncontrolling interests; and the
related tax effects thereof. Adjusted
operating income includes equity in
earnings of operating joint ventures
and the related tax effects thereof.
Revenues and benefits and expenses
shown as components of adjusted
operating income, are presented on
the same basis as pre-tax adjusted
operating income and are adjusted for
the items above as well.
See Management’s Discussion and
Analysis of Financial Condition and
Results of Operations for a discussion
of results based on adjusted operating
income and the Consolidated Financial
Statements for a reconciliation of
results based on adjusted operating
income to GAAP results.
(B) Operating return on average
equity is calculated by dividing
adjusted operating income after
income taxes by average attributed
equity for the Financial Services
Businesses excluding accumulated
other comprehensive income. An
alternative measure to operating
return on average equity is return on
average equity. Return on average
equity is calculated by dividing income
from continuing operations after-tax
of the Financial Services Businesses
attributable to Prudential Financial,
Inc. by average total attributed equity
for the Financial Services Businesses.
Both income amounts above give
effect to the direct equity adjustment
for earnings per share calculation.
Adjusted operating income
Income from continuing operations before
income taxes and equity in earnings of
operating joint ventures (GAAP)
Adjusted operating revenues
Revenues (GAAP)
Financial Services Businesses
Adjusted Operating Income(A) and
Income from Continuing Operations
(pre-tax, in millions)
Financial Services Businesses
Adjusted Operating Revenues(A)
and GAAP Revenues
(in billions)
Assets Under Management
(in billions)
Financial Services Businesses
Operating Return on Average Equity(B)
and Return on Average Equity(B)
Operating return on average equity
Return on average equity
2012
2010
$1,000
$0
$2,000
$3,000
$4,000
$5,000
2011
$0
$20
$40
$60
$80
$100
2010 2011 2012
2010 2011 2012
$0
$200
$400
$600
$800
$1,000
$1,200
0%
2%
4%
6%
8%
10%
12%
2011 2012
2010