Prudential 2012 Annual Report Download - page 18
Download and view the complete annual report
Please find page 18 of the 2012 Prudential annual report below. You can navigate through the pages in the report by either clicking on the pages listed below, or by using the keyword search tool below to find specific information within the annual report.
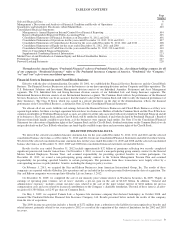
Pre-tax adjusted operating income for the Financial Services Businesses for the year ended December 31, 2012 was $3,949 million
compared to $3,836 million for 2011. Shown below are the contributions of each segment and Corporate and Other operations to our
adjusted operating income for the years ended December 31, 2012, 2011 and 2010 and a reconciliation of adjusted operating income of our
segments and Corporate and Other operations to income from continuing operations before income taxes and equity in earnings of
operating joint ventures.
Year ended December 31,
2012 2011 2010
(in millions)
Adjusted operating income before income taxes for segments of the Financial Services Businesses:
Individual Annuities ................................................................................ $1,039 $ 662 $ 950
Retirement ....................................................................................... 638 594 565
Asset Management ................................................................................. 503 782 506
Total U.S. Retirement Solutions and Investment Management Division ................................... 2,180 2,038 2,021
Individual Life .................................................................................... 384 482 482
Group Insurance ................................................................................... 16 163 174
Total U.S. Individual Life and Group Insurance Division ............................................... 400 645 656
International Insurance .............................................................................. 2,704 2,263 1,887
Total International Insurance Division .............................................................. 2,704 2,263 1,887
Corporate and Other ................................................................................ (1,335) (1,110) (936)
Adjusted operating income before income taxes for the Financial Services Businesses ............................ 3,949 3,836 3,628
Reconciling Items:
Realized investment gains (losses), net, and related adjustments(1) ........................................... (3,666) 2,503 152
Charges related to realized investment gains (losses), net(2) ................................................. 857 (1,656) (179)
Investment gains (losses) on trading account assets supporting insurance liabilities, net(3) ......................... 610 223 501
Change in experience-rated contractholder liabilities due to asset value changes(4) .............................. (540) (123) (631)
Divested businesses(5) .............................................................................. (597) 101 18
Equity in earnings of operating joint ventures and earnings attributable to noncontrolling interests(6) ................ (1) (189) (95)
Income from continuing operations before income taxes and equity in earnings of operating joint ventures for Financial
Services Businesses .................................................................................. 612 4,695 3,394
Income (loss) from continuing operations before income taxes for Closed Block Business ............................. 64 214 746
Consolidated income from continuing operations before income taxes and equity in earnings of operating joint ventures ..... $ 676 $4,909 $4,140
(1) Revenues exclude Realized investment gains (losses), net, and related adjustments. See “—Realized Investment Gains and Losses.”
(2) Revenues exclude related charges resulting from payments related to market value adjustment features of certain of our annuity products and the impact
of Realized investment gains (losses), net, on the amortization of unearned revenue reserves. Benefits and expenses exclude related charges that
represent the impact of Realized investment gains (losses), net, on the amortization of deferred policy acquisition costs, and other costs.
(3) Revenues exclude net investment gains and losses on trading account assets supporting insurance liabilities. See “—Experience-Rated Contractholder
Liabilities, Trading Account Assets Supporting Insurance Liabilities and Other Related Investments.”
(4) Benefits and expenses exclude changes in contractholder liabilities due to asset value changes in the pool of investments supporting these experience-
rated contracts. See “—Experience-Rated Contractholder Liabilities, Trading Account Assets Supporting Insurance Liabilities and Other Related
Investments.”
(5) See “—Divested Businesses.”
(6) Equity in earnings of operating joint ventures are included in adjusted operating income but excluded from income from continuing operations before
income taxes and equity in earnings of operating joint ventures as they are reflected on a U.S. GAAP basis on an after-tax basis as a separate line in our
Consolidated Statements of Operations. Earnings attributable to noncontrolling interests are excluded from adjusted operating income but included in
income from continuing operations before taxes and equity earnings of operating joint ventures as they are reflected on a U.S. GAAP basis as a separate
line in our Consolidated Statements of Operations. Earnings attributable to noncontrolling interests represent the portion of earnings from consolidated
entities that relates to the equity interests of minority investors.
Results for 2012 presented above reflect the following:
Individual Annuities. Segment results for 2012 increased in comparison to 2011, reflecting the favorable comparative impact of
changes in the estimated profitability of the business, driven by the net impacts of market performance, and annual reviews and updates of
economic and actuarial assumptions and other refinements. Excluding these items, results increased in comparison to 2011, reflecting
higher asset-based fee income, driven by higher average variable annuity account values, net of an increased level of distribution and
amortization costs, partially offset by higher general and administrative expenses, net of capitalization.
Retirement. Segment results for 2012 increased in comparison to 2011. The increase primarily reflects the favorable impact of a
legal settlement in 2012, as well as higher asset-based fee income and net investment spread results. These increases were partially offset
by costs to write-off an intangible asset related to an acquired business, higher general and administrative expenses, net of capitalization,
and an unfavorable comparative reserve impact from case experience.
Asset Management. Segment results declined in 2012 in comparison to 2011 reflecting less favorable results from the segment’s
strategic investing activities, which reflect charges for the current year on real estate investments, compared to a gain in the prior year on
the partial sale of a real estate seed investment. The lower contribution from these activities, as well as higher expenses in the current year
and the comparative impact of a gain on the sale of an operating joint venture in 2011 offset the benefit from higher asset management fees.
Individual Life. Segment results declined from 2011 primarily driven by the unfavorable comparative impact from our annual
reviews and updates of economic and actuarial assumptions as well as costs incurred in 2012 associated with our acquisition of The
Hartford’s individual life insurance business.
Group Insurance. Segment results declined in 2012 in comparison to 2011 primarily due to less favorable group life and disability
underwriting results and higher expenses.
16 Prudential Financial, Inc. 2012 Annual Report


