Prudential 2012 Annual Report Download - page 12
Download and view the complete annual report
Please find page 12 of the 2012 Prudential annual report below. You can navigate through the pages in the report by either clicking on the pages listed below, or by using the keyword search tool below to find specific information within the annual report.-
 1
1 -
 2
2 -
 3
3 -
 4
4 -
 5
5 -
 6
6 -
 7
7 -
 8
8 -
 9
9 -
 10
10 -
 11
11 -
 12
12 -
 13
13 -
 14
14 -
 15
15 -
 16
16 -
 17
17 -
 18
18 -
 19
19 -
 20
20 -
 21
21 -
 22
22 -
23
-
24
-
25
-
26
-
27
-
28
-
29
-
30
-
31
-
32
-
33
-
34
-
35
-
36
-
37
-
38
-
39
-
40
-
41
-
42
-
43
-
44
-
45
-
46
-
47
-
48
-
49
-
50
-
51
-
52
-
53
-
54
-
55
-
56
-
57
-
58
-
59
-
60
-
61
-
62
-
63
-
64
-
65
-
66
-
67
-
68
-
69
-
70
-
71
-
72
-
73
-
74
-
75
-
76
-
77
-
78
-
79
-
80
-
81
-
82
-
83
-
84
-
85
-
86
-
87
-
88
-
89
-
90
-
91
-
92
-
93
-
94
-
95
-
96
-
97
-
98
-
99
-
100
-
101
-
102
-
103
-
104
-
105
-
106
-
107
-
108
-
109
-
110
-
111
-
112
-
113
-
114
-
115
-
116
-
117
-
118
-
119
-
120
-
121
-
122
-
123
-
124
-
125
-
126
-
127
-
128
-
129
-
130
-
131
-
132
-
133
-
134
-
135
-
136
-
137
-
138
-
139
-
140
-
141
-
142
-
143
-
144
-
145
-
146
-
147
-
148
-
149
-
150
-
151
-
152
-
153
-
154
-
155
-
156
-
157
-
158
-
159
-
160
-
161
-
162
-
163
-
164
-
165
-
166
-
167
-
168
-
169
-
170
-
171
-
172
-
173
-
174
-
175
-
176
-
177
-
178
-
179
-
180
-
181
-
182
-
183
-
184
-
185
-
186
-
187
-
188
-
189
-
190
-
191
-
192
-
193
-
194
-
195
-
196
-
197
-
198
-
199
-
200
-
201
-
202
-
203
-
204
-
205
-
206
-
207
-
208
-
209
-
210
-
211
-
212
-
213
-
214
-
215
-
216
-
217
-
218
-
219
-
220
-
221
-
222
-
223
-
224
-
225
-
226
-
227
-
228
-
229
-
230
-
231
-
232
 |
 |

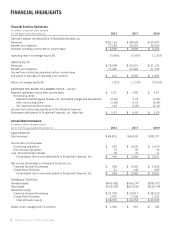
Our Gibraltar Life operations use a November 30 fiscal year end. Consolidated balance sheet data as of December 31, 2012, 2011,
2010, 2009 and 2008 includes Gibraltar Life assets and liabilities as of November 30. Consolidated income statement data for 2012, 2011,
2010, 2009 and 2008 includes Gibraltar Life results for the twelve months ended November 30, 2012, 2011, 2010, 2009 and 2008,
respectively.
This selected consolidated financial information should be read in conjunction with “Management’s Discussion and Analysis of
Financial Condition and Results of Operations” and the Consolidated Financial Statements included elsewhere herein.
Year Ended December 31,
2012 2011 2010 2009 2008
(in millions, except per share and ratio information)
Income Statement Data:
Revenues:
Premiums .......................................................... $65,354 $24,301 $18,238 $ 16,497 $15,459
Policy charges and fee income .......................................... 4,489 3,924 3,323 2,832 3,138
Net investment income ................................................ 13,661 13,124 11,865 11,390 11,824
Asset management fees and other income ................................. 2,752 4,850 3,741 4,513 757
Realized investment gains (losses), net .................................... (1,441) 2,831 1,050 (2,897) (2,457)
Total revenues ................................................... 84,815 49,030 38,217 32,335 28,721
Benefits and expenses:
Policyholders’ benefits ................................................ 65,131 23,614 18,285 16,346 16,531
Interest credited to policyholders’ account balances ......................... 4,234 4,484 4,209 4,484 2,335
Dividends to policyholders ............................................. 2,176 2,723 2,189 1,298 2,218
Amortization of deferred policy acquisition costs ........................... 1,504 2,695 1,085 1,131 1,102
General and administrative expenses ..................................... 11,094 10,605 8,309 7,788 8,035
Total benefits and expenses ........................................ 84,139 44,121 34,077 31,047 30,221
Income (loss) from continuing operations before income taxes and equity in earnings of
operating joint ventures .................................................. 676 4,909 4,140 1,288 (1,500)
Income tax expense (benefit) ............................................... 204 1,488 1,243 (118) (589)
Income (loss) from continuing operations before equity in earnings of operating joint
ventures .............................................................. 472 3,421 2,897 1,406 (911)
Equity in earnings of operating joint ventures, net of taxes ........................ 60 182 82 1,523 (447)
Income (loss) from continuing operations ..................................... 532 3,603 2,979 2,929 (1,358)
Income (loss) from discontinued operations, net of taxes .......................... 15 35 33 (19) 146
Net income (loss) ........................................................ 547 3,638 3,012 2,910 (1,212)
Less: Income (loss) attributable to noncontrolling interests ........................ 78 72 11 (34) 36
Net Income (loss) attributable to Prudential Financial, Inc. ........................ $ 469 $ 3,566 $ 3,001 $ 2,944 $ (1,248)
Basic earnings per share—Common Stock:
Income (loss) from continuing operations attributable to
Prudential Financial, Inc. ............................................ $ 0.91 $ 7.01 $ 5.31 $ 7.32 $ (3.20)
Income (loss) from discontinued operations, net of taxes ...................... 0.04 0.07 0.07 (0.04) 0.34
Net income (loss) attributable to Prudential Financial, Inc. .................... $ 0.95 $ 7.08 $ 5.38 $ 7.28 $ (2.86)
Diluted earnings per share—Common Stock:
Income (loss) from continuing operations attributable to
Prudential Financial, Inc. ............................................ $ 0.91 $ 6.92 $ 5.25 $ 7.27 $ (3.20)
Income (loss) from discontinued operations, net of taxes ...................... 0.03 0.07 0.07 (0.04) 0.34
Net income (loss) attributable to Prudential Financial, Inc. .................... $ 0.94 $ 6.99 $ 5.32 $ 7.23 $ (2.86)
Dividends declared per share—Common Stock ................................. $ 1.60 $ 1.45 $ 1.15 $ 0.70 $ 0.58
Basic and diluted earnings per share—Class B Stock:
Income (loss) from continuing operations attributable to
Prudential Financial, Inc. ............................................ $ 11.50 $ 61.00 $229.00 $(164.50) $ (9.50)
Income (loss) from discontinued operations, net of taxes ...................... (1.00) 0.00 0.50 0.00 0.00
Net income (loss) attributable to Prudential Financial, Inc. .................... $ 10.50 $ 61.00 $229.50 $(164.50) $ (9.50)
Dividends declared per share—Class B Stock .............................. $ 9.625 $ 9.625 $ 9.625 $ 9.625 $ 9.625
Ratio of earnings to fixed charges(1) ..................................... 1.10 1.82 1.75 1.67 —
As of December 31,
2012 2011 2010 2009 2008
(in millions)
Balance Sheet Data:
Total investments excluding policy loans ........................................... $394,007 $344,688 $273,245 $250,406 $232,322
Separate account assets ......................................................... 253,254 218,380 207,776 174,074 147,095
Total assets .................................................................. 709,298 620,244 535,744 476,449 442,399
Future policy benefits and policyholders’ account balances ............................ 350,463 305,229 240,489 227,516 221,653
Separate account liabilities ...................................................... 253,254 218,380 207,776 174,074 147,095
Short-term debt ............................................................... 2,484 2,336 1,982 3,122 10,535
Long-term debt ............................................................... 24,729 24,622 23,653 21,037 20,290
Total liabilities ............................................................... 670,007 585,403 505,696 453,312 431,307
Prudential Financial, Inc. equity .................................................. 38,575 34,253 29,535 22,603 10,741
Noncontrolling interests ........................................................ 716 588 513 534 351
Total equity .................................................................. $ 39,291 $ 34,841 $ 30,048 $ 23,137 $ 11,092
10 Prudential Financial, Inc. 2012 Annual Report