Prudential 2012 Annual Report Download - page 19
Download and view the complete annual report
Please find page 19 of the 2012 Prudential annual report below. You can navigate through the pages in the report by either clicking on the pages listed below, or by using the keyword search tool below to find specific information within the annual report.-
 1
1 -
2
-
3
-
4
-
5
-
6
-
7
-
8
-
 9
9 -
 10
10 -
 11
11 -
 12
12 -
 13
13 -
 14
14 -
 15
15 -
 16
16 -
 17
17 -
 18
18 -
 19
19 -
 20
20 -
 21
21 -
 22
22 -
 23
23 -
 24
24 -
 25
25 -
 26
26 -
 27
27 -
 28
28 -
 29
29 -
30
-
31
-
32
-
33
-
34
-
35
-
36
-
37
-
38
-
39
-
40
-
41
-
42
-
43
-
44
-
45
-
46
-
47
-
48
-
49
-
50
-
51
-
52
-
53
-
54
-
55
-
56
-
57
-
58
-
59
-
60
-
61
-
62
-
63
-
64
-
65
-
66
-
67
-
68
-
69
-
70
-
71
-
72
-
73
-
74
-
75
-
76
-
77
-
78
-
79
-
80
-
81
-
82
-
83
-
84
-
85
-
86
-
87
-
88
-
89
-
90
-
91
-
92
-
93
-
94
-
95
-
96
-
97
-
98
-
99
-
100
-
101
-
102
-
103
-
104
-
105
-
106
-
107
-
108
-
109
-
110
-
111
-
112
-
113
-
114
-
115
-
116
-
117
-
118
-
119
-
120
-
121
-
122
-
123
-
124
-
125
-
126
-
127
-
128
-
129
-
130
-
131
-
132
-
133
-
134
-
135
-
136
-
137
-
138
-
139
-
140
-
141
-
142
-
143
-
144
-
145
-
146
-
147
-
148
-
149
-
150
-
151
-
152
-
153
-
154
-
155
-
156
-
157
-
158
-
159
-
160
-
161
-
162
-
163
-
164
-
165
-
166
-
167
-
168
-
169
-
170
-
171
-
172
-
173
-
174
-
175
-
176
-
177
-
178
-
179
-
180
-
181
-
182
-
183
-
184
-
185
-
186
-
187
-
188
-
189
-
190
-
191
-
192
-
193
-
194
-
195
-
196
-
197
-
198
-
199
-
200
-
201
-
202
-
203
-
204
-
205
-
206
-
207
-
208
-
209
-
210
-
211
-
212
-
213
-
214
-
215
-
216
-
217
-
218
-
219
-
220
-
221
-
222
-
223
-
224
-
225
-
226
-
227
-
228
-
229
-
230
-
231
-
232
 |
 |
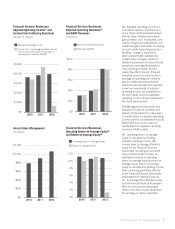
International Insurance. Segment results for 2012 increased in comparison to 2011 in both our Life Planner and Gibraltar Life and
Other operations including a net favorable impact from foreign currency exchange rates. Results from the segment’s Life Planner
operations primarily reflect business growth driven by sales results and continued strong persistency. Improved results from the segment’s
Gibraltar Life and Other operations were primarily driven by business growth, additional synergies and lower integration costs associated
with our acquisition of the former Star and Edison businesses, and the absence of claims and expenses associated with the 2011 earthquake
in Japan. Offsetting these favorable items was a greater benefit in the prior year from partial sales of our indirect investment in China
Pacific Group.
Corporate and Other operations. The results for 2012 as compared to 2011 reflect an increased loss primarily due to a higher level
of expenses in other corporate activities and greater interest expense, net of investment income, driven primarily from higher levels of
capital debt.
Closed Block Business. Income from continuing operations before income taxes decreased $150 million in 2012 compared to 2011,
primarily reflecting lower net realized investment gains and net investment income, partially offset by a decline in the policyholder
dividend obligation expense.
Accounting Policies & Pronouncements
Application of Critical Accounting Estimates
The preparation of financial statements in conformity with accounting principles generally accepted in the United States of America,
or U.S. GAAP, requires the application of accounting policies that often involve a significant degree of judgment. Management, on an
ongoing basis, reviews estimates and assumptions used in the preparation of financial statements. If management determines that
modifications in assumptions and estimates are appropriate given current facts and circumstances, results of operations and financial
position as reported in the Consolidated Financial Statements could change significantly.
The following sections discuss the accounting policies applied in preparing our financial statements that management believes are
most dependent on the application of estimates and assumptions and require management’s most difficult, subjective, or complex
judgments.
Deferred Policy Acquisition and Other Costs
We capitalize costs that are directly related to the acquisition or renewal of insurance and annuity contracts. These costs primarily
include commissions, as well as costs of policy issuance and underwriting and certain other expenses that are directly related to
successfully negotiated contracts. See Note 2 to our Consolidated Financial Statements for a discussion of the new authoritative guidance
adopted effective January 1, 2012, regarding which costs relating to the acquisition of new or renewal insurance contracts qualify for
deferral. We have also deferred costs associated with sales inducements related to our variable and fixed annuity contracts primarily within
our Individual Annuities segment. Sales inducements are amounts that are credited to the policyholder’s account balance as an inducement
to purchase the contract. For additional information about sales inducements, see Note 11 to the Consolidated Financial Statements. We
amortize these deferred policy acquisition costs, or DAC, and deferred sales inducements, or DSI, over the expected lives of the contracts,
based on our estimates of the level and timing of gross margins, gross profits, or gross premiums, depending on the type of contract. As
described in more detail below, in calculating DAC and DSI amortization, we are required to make assumptions about investment returns,
mortality, persistency, and other items that impact our estimates of the level and timing of gross margins, gross profits, or gross premiums.
We also periodically evaluate the recoverability of our DAC and DSI. For certain contracts, this evaluation is performed as part of our
premium deficiency testing, as discussed further below in “—Policyholder Liabilities.” As of December 31, 2012, DAC and DSI in our
Financial Services Businesses were $13.7 billion and $1.4 billion, respectively, and DAC in our Closed Block Business was $412 million.
Amortization methodologies
DAC associated with the traditional participating products of our Closed Block Business is amortized over the expected lives of those
contracts in proportion to estimated gross margins. Gross margins consider premiums, investment returns, benefit claims, costs for policy
administration, changes in reserves, and dividends to policyholders. We evaluate our estimates of future gross margins and adjust the
related DAC balance with a corresponding charge or credit to current period earnings for the effects of actual gross margins and changes in
our expected future gross margins. DAC adjustments generally have not created significant volatility in our results of operations since
many of the factors that affect gross margins are also included in the determination of our dividends to these policyholders and, during
most years, the Closed Block has recognized a cumulative policyholder dividend obligation expense in “Policyholders’ dividends,” for the
excess of actual cumulative earnings over expected cumulative earnings as determined at the time of demutualization. However, if actual
cumulative earnings fall below expected cumulative earnings in future periods, thereby eliminating the cumulative policyholder dividend
obligation expense, changes in gross margins and DAC amortization would result in a net impact to the Closed Block Business results of
operations. As of December 31, 2012, the excess of actual cumulative earnings over the expected cumulative earnings was $885 million.
DAC associated with the non-participating whole life and term life policies of our Individual Life segment and the whole life, term
life, endowment and health policies of our International Insurance segment is amortized in proportion to gross premiums.
DAC and DSI associated with the variable and universal life policies of our Individual Life and International Insurance segments and
the variable and fixed annuity contracts of our Individual Annuities and International Insurance segments are amortized over the expected
life of these policies in proportion to total gross profits. In calculating gross profits, we consider mortality, persistency, and other elements
as well as rates of return on investments associated with these contracts and the costs related to our guaranteed minimum death and
guaranteed minimum income benefits. Total gross profits include both actual experience and estimates of gross profits for future periods.
We regularly evaluate and adjust the related DAC and DSI balances with a corresponding charge or credit to current period earnings for the
impact of actual gross profits and changes in our assumptions regarding estimated future gross profits on our DAC and DSI amortization
rates. Adjustments to the DAC and DSI balances include the impact to our estimate of total gross profits of the annual review of
assumptions, our quarterly adjustments for current period experience, and our quarterly adjustments for market performance. Each of these
adjustments is further discussed below in “—Annual assumptions review and quarterly adjustments.”
Prudential Financial, Inc. 2012 Annual Report 17