Prudential 2012 Annual Report Download - page 8
Download and view the complete annual report
Please find page 8 of the 2012 Prudential annual report below. You can navigate through the pages in the report by either clicking on the pages listed below, or by using the keyword search tool below to find specific information within the annual report.-
 1
1 -
 2
2 -
 3
3 -
 4
4 -
 5
5 -
 6
6 -
 7
7 -
 8
8 -
 9
9 -
 10
10 -
 11
11 -
 12
12 -
 13
13 -
 14
14 -
 15
15 -
 16
16 -
 17
17 -
 18
18 -
 19
19 -
20
-
21
-
22
-
23
-
24
-
25
-
26
-
27
-
28
-
29
-
30
-
31
-
32
-
33
-
34
-
35
-
36
-
37
-
38
-
39
-
40
-
41
-
42
-
43
-
44
-
45
-
46
-
47
-
48
-
49
-
50
-
51
-
52
-
53
-
54
-
55
-
56
-
57
-
58
-
59
-
60
-
61
-
62
-
63
-
64
-
65
-
66
-
67
-
68
-
69
-
70
-
71
-
72
-
73
-
74
-
75
-
76
-
77
-
78
-
79
-
80
-
81
-
82
-
83
-
84
-
85
-
86
-
87
-
88
-
89
-
90
-
91
-
92
-
93
-
94
-
95
-
96
-
97
-
98
-
99
-
100
-
101
-
102
-
103
-
104
-
105
-
106
-
107
-
108
-
109
-
110
-
111
-
112
-
113
-
114
-
115
-
116
-
117
-
118
-
119
-
120
-
121
-
122
-
123
-
124
-
125
-
126
-
127
-
128
-
129
-
130
-
131
-
132
-
133
-
134
-
135
-
136
-
137
-
138
-
139
-
140
-
141
-
142
-
143
-
144
-
145
-
146
-
147
-
148
-
149
-
150
-
151
-
152
-
153
-
154
-
155
-
156
-
157
-
158
-
159
-
160
-
161
-
162
-
163
-
164
-
165
-
166
-
167
-
168
-
169
-
170
-
171
-
172
-
173
-
174
-
175
-
176
-
177
-
178
-
179
-
180
-
181
-
182
-
183
-
184
-
185
-
186
-
187
-
188
-
189
-
190
-
191
-
192
-
193
-
194
-
195
-
196
-
197
-
198
-
199
-
200
-
201
-
202
-
203
-
204
-
205
-
206
-
207
-
208
-
209
-
210
-
211
-
212
-
213
-
214
-
215
-
216
-
217
-
218
-
219
-
220
-
221
-
222
-
223
-
224
-
225
-
226
-
227
-
228
-
229
-
230
-
231
-
232
 |
 |

6 Prudential Financial, Inc. 2012 Annual Report
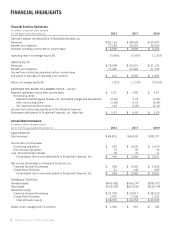
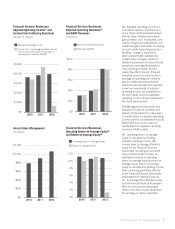
Financial Services Businesses
In millions, except per share amounts
For the years ended December 31, 2012 2011 2010
RESULTS BASED ON ADJUSTED OPERATING INCOME (A)
Revenues $ 81,133 $ 38,933 $ 30,087
Benefits and expenses 77,184 35,097 26,459
Adjusted operating income before income taxes $ 3,949 $ 3,836 $ 3,628
Operating return on average equity (B) 10.80 % 10.60 % 11.20 %
GAAP RESULTS
Revenues $ 78,558 $ 42,015 $ 31,131
Benefits and expenses 77,946 37,320 27,737
Income from continuing operations before income taxes
and equity in earnings of operating joint ventures $ 612 $ 4,695 $ 3,394
Return on average equity (B) 1.22 % 11.10 % 10.00 %
EARNINGS PER SHARE OF COMMON STOCK—diluted
Adjusted operating income after income taxes $ 6.27 $ 5.83 $ 5.67
Reconciling items:
Realized investment gains (losses), net, and related charges and adjustments (5.94 ) 1.73 (0.06 )
Other reconciling items (1.06 ) 0.41 (0.24 )
Tax (expense) benefit on above 1.64 (1.05 ) (0.12 )
Income from continuing operations of the Financial Services
Businesses attributable to Prudential Financial, Inc. (after-tax) $ 0.91 $ 6.92 $ 5.25
Consolidated Information
In millions, unless otherwise noted
As of or for the years ended December 31, 2012 2011 2010
GAAP RESULTS
Total revenues $ 84,815 $ 49,030 $ 38,217
Income after income taxes:
Continuing operations $ 532 $ 3,603 $ 2,979
Discontinued operations 15 35 33
Less: Noncontrolling interests 78 72 11
Consolidated net income attributable to Prudential Financial, Inc. $ 469 $ 3,566 $ 3,001
Net income attributable to Prudential Financial, Inc.
Financial Services Businesses $ 428 $ 3,420 $ 2,506
Closed Block Business 41 146 495
Consolidated net income attributable to Prudential Financial, Inc. $ 469 $ 3,566 $ 3,001
FINANCIAL POSITION
Invested assets $ 405,582 $ 356,247 $ 283,912
Total assets $ 709,298 $ 620,244 $ 535,744
Attributed equity:
Financial Services Businesses $ 37,078 $ 32,817 $ 28,310
Closed Block Business 1,497 1,436 1,225
Total attributed equity $ 38,575 $ 34,253 $ 29,535
Assets under management (in billions) $ 1,060 $ 901 $ 784
FINANCIAL HIGHLIGHTS