Omron 2016 Annual Report Download - page 8
Download and view the complete annual report
Please find page 8 of the 2016 Omron annual report below. You can navigate through the pages in the report by either clicking on the pages listed below, or by using the keyword search tool below to find specific information within the annual report.-
 1
1 -
 2
2 -
 3
3 -
 4
4 -
 5
5 -
 6
6 -
 7
7 -
 8
8 -
 9
9 -
 10
10 -
 11
11 -
 12
12 -
 13
13 -
 14
14 -
 15
15 -
 16
16 -
 17
17 -
 18
18 -
 19
19 -
20
-
21
-
22
-
23
-
24
-
25
-
26
-
27
-
28
-
29
-
30
-
31
-
32
-
33
-
34
-
35
-
36
-
37
-
38
-
39
-
40
-
41
-
42
-
43
-
44
-
45
-
46
-
47
-
48
-
49
-
50
-
51
-
52
-
53
-
54
-
55
-
56
-
57
-
58
-
59
-
60
-
61
-
62
-
63
-
64
-
65
-
66
-
67
-
68
-
69
-
70
-
71
-
72
-
73
-
74
-
75
-
76
-
77
-
78
-
79
-
80
-
81
-
82
-
83
-
84
-
85
-
86
-
87
-
88
-
89
-
90
-
91
-
92
-
93
-
94
-
95
-
96
-
97
-
98
-
99
-
100
-
101
-
102
 |
 |

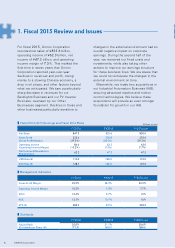
changes in the external environment had an
overall negative impact on corporate
earnings. During the second half of the
year, we reviewed our fixed costs and
investments, while also taking other
actions to improve our earnings structure
for these business lines. We are aware that
we could not anticipate the changes in the
external environment on time.
Meanwhile, we made two acquisitions in
our Industrial Automation Business (IAB),
securing advanced robotics and motion
control technologies. We believe these
acquisitions will provide an even stronger
foundation for growth in our IAB.
For fiscal 2015, Omron Corporation
recorded net sales of ¥833.6 billion,
operating income of ¥62.3 billion, net
income of ¥47.3 billion, and operating
income margin of 7.5%. This marked the
first time in seven years that Omron
Corporation reported year-over-year
declines in revenues and profit, owing
mainly to a slowing Chinese economy, a
drop in oil prices, and other factors beyond
what we anticipated. We saw a particularly
sharp decrease in revenues for our
Backlights Business and our PV Inverter
Business, overseen by our Other
Businesses segment. Declines in these and
other businesses particularly sensitive to
1. Fiscal 2015 Review and Issues
■
Management Indicators
FY2014 FY2015 FY2016 plan
Gross Profit Margin 39.3
%
38.5
%
39.3
%
Operating Income Margin 10.2
%
7.5
%
7.7
%
ROIC 13.4
%
9.7
%
10
%
ROE 13.5
%
10.1
%
10
%
EPS (¥) 283.9219.0222.2
■
Dividends
FY2014 FY2015 FY2016 plan
Payout Ratio
(Dividends per Share (¥))
25.0
%
(
71.0
)
31.1
%
(
68.0
)
30.6
%
(
68.0
)
■
Fiscal 2014 /2015 Earnings and Fiscal 2016 Plans
FY2014 FY2015 FY2016 plan
Net Sales 847.3833.6820.0
Gross Profit
(Gross Profit Margin)
332.6
(39.3%)
320.8
(38.5%)
322.0
(39.3%)
Operating Income
(Operating Income Margin)
86.6
(10.2%)
62.3
(7.5%)
63.0
(7.7%)
Net Income Attributable to
Shareholders 62.247.347.5
USD Rate (¥) 110.0120.2 110.0
EUR Rate (¥) 138.7132.2 125.0
(Billions of yen)
6OMRON Corporation