Office Depot 2010 Annual Report Download - page 4
Download and view the complete annual report
Please find page 4 of the 2010 Office Depot annual report below. You can navigate through the pages in the report by either clicking on the pages listed below, or by using the keyword search tool below to find specific information within the annual report.-
 1
1 -
 2
2 -
 3
3 -
 4
4 -
 5
5 -
 6
6 -
 7
7 -
 8
8 -
 9
9 -
 10
10 -
 11
11 -
 12
12 -
 13
13 -
 14
14 -
 15
15 -
16
-
17
-
18
-
19
-
20
-
21
-
22
-
23
-
24
-
25
-
26
-
27
-
28
-
29
-
30
-
31
-
32
-
33
-
34
-
35
-
36
-
37
-
38
-
39
-
40
-
41
-
42
-
43
-
44
-
45
-
46
-
47
-
48
-
49
-
50
-
51
-
52
-
53
-
54
-
55
-
56
-
57
-
58
-
59
-
60
-
61
-
62
-
63
-
64
-
65
-
66
-
67
-
68
-
69
-
70
-
71
-
72
 |
 |

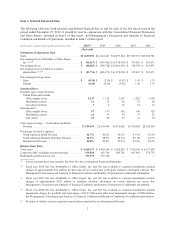
Item 6. Selected Financial Data.
The following table sets forth selected consolidated financial data at and for each of the five fiscal years in the
period ended December 25, 2010. It should be read in conjunction with the Consolidated Financial Statements
and Notes thereto, included in Item 8 of this report, and Management’s Discussion and Analysis of Financial
Condition and Results of Operations, included in Item 7 of this report.
(In thousands, except per share amounts and statistical data) 2010 (1) 2009 2008 2007 2006
(Restated)
Statements of Operations Data:
Sales ........................................ $11,633,094 $12,144,467 $14,495,544 $15,527,537 $15,010,781
Net earnings (loss) attributable to Office Depot,
Inc (2)(3)(4) .................................. $ (44,623) $ (596,465) $ (1,478,938) $ 395,615 $ 503,471
Net earnings (loss) ............................. $ (46,205) $ (598,724) $ (1,481,003) $ 394,704 $ 503,471
Net earnings (loss) available to common
shareholders (2)(3)(4) ........................... $ (81,736) $ (626,971) $ (1,478,938) $ 395,615 $ 503,471
Net earnings (loss) per share:
Basic ...................................... $ (0.30) $ (2.30) $ (5.42) $ 1.45 $ 1.79
Diluted .................................... (0.30) (2.30) (5.42) 1.43 1.75
Statistical Data:
Facilities open at end of period:
United States and Canada:
Office supply stores ........................ 1,147 1,152 1,267 1,222 1,158
Distribution centers ........................ 13 15 20 21 20
Crossdock facilities ........................ 36121210
International (5):
Office supply stores ........................ 97 137 162 148 125
Distribution centers ........................ 26 39 43 33 32
Call centers .............................. 25 29 27 31 30
Total square footage — North American Retail
Division ................................... 27,559,184 28,109,844 30,672,862 29,790,082 28,520,269
Percentage of sales by segment:
North American Retail Division ................ 42.7% 42.1% 42.2% 43.9% 45.2%
North American Business Solutions Division ...... 28.3% 28.7% 28.6% 29.1% 30.5%
International Division ........................ 29.0% 29.2% 29.2% 27.0% 24.3%
Balance Sheet Data:
Total assets ................................... $ 4,569,437 $ 4,890,346 $ 5,268,226 $ 7,256,540 $ 6,557,438
Long-term debt, excluding current maturities ........ 659,820 662,740 688,788 607,462 570,752
Redeemable preferred stock, net .................. 355,979 355,308 — — —
(1) Certain amounts have been restated. See Note B to the Consolidated Financial Statements.
(2) Fiscal year 2010 Net loss attributable to Office Depot, Inc. and Net loss available to common shareholders include
charges of approximately $51 million for the write-off of Construction in Progress related to developed software. See
Management’s Discussion and Analysis of Financial Condition and Results of Operations for additional information.
(2) Fiscal year 2009 Net loss attributable to Office Depot, Inc. and Net loss available to common shareholders include
charges of approximately $322 million to establish valuation allowances on certain deferred tax assets. See
Management’s Discussion and Analysis of Financial Condition and Results of Operations for additional information.
(3) Fiscal year 2008 Net loss attributable to Office Depot, Inc. and Net loss available to common shareholders include
impairment charges for goodwill and trade names of $1.27 billion and other asset impairment charges of $222 million.
See Management’s Discussion and Analysis of Financial Condition and Results of Operations for additional information.
(5) Facilities of wholly-owned or majority-owned entities operated by our International Division.
3