Office Depot 2010 Annual Report Download - page 37
Download and view the complete annual report
Please find page 37 of the 2010 Office Depot annual report below. You can navigate through the pages in the report by either clicking on the pages listed below, or by using the keyword search tool below to find specific information within the annual report.-
 1
1 -
2
-
3
-
4
-
5
-
6
-
7
-
8
-
9
-
10
-
11
-
12
-
13
-
14
-
15
-
16
-
17
-
18
-
19
-
20
-
21
-
22
-
23
-
24
-
25
-
26
-
 27
27 -
 28
28 -
 29
29 -
 30
30 -
 31
31 -
 32
32 -
 33
33 -
 34
34 -
 35
35 -
 36
36 -
 37
37 -
 38
38 -
 39
39 -
 40
40 -
 41
41 -
 42
42 -
 43
43 -
 44
44 -
 45
45 -
 46
46 -
 47
47 -
48
-
49
-
50
-
51
-
52
-
53
-
54
-
55
-
56
-
57
-
58
-
59
-
60
-
61
-
62
-
63
-
64
-
65
-
66
-
67
-
68
-
69
-
70
-
71
-
72
 |
 |

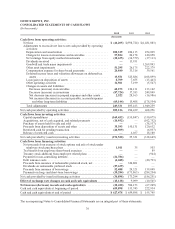
OFFICE DEPOT, INC.
CONSOLIDATED STATEMENTS OF CASH FLOWS
(In thousands)
2010 2009 2008
(Restated)
Cash flows from operating activities:
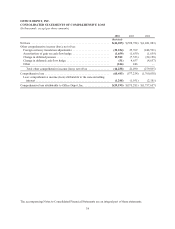
Net loss .................................................. $ (46,205) $(598,724) $(1,481,003)
Adjustments to reconcile net loss to net cash provided by operating
activities:
Depreciation and amortization .............................. 208,319 224,115 254,099
Charges for losses on inventories and receivables ............... 57,824 80,178 140,058
Net earnings from equity method investments .................. (30,635) (30,579) (37,113)
Dividends received ....................................... —13,931 —
Goodwill and trade name impairments ........................ —— 1,269,893
Other asset impairments ................................... 51,295 26,175 222,379
Compensation expense for share-based payments ............... 20,840 33,316 39,561
Deferred income taxes and valuation allowances on deferred tax
assets ................................................ 15,551 325,886 (108,099)
Loss (gain) on disposition of assets .......................... 8,709 7,655 (13,443)
Other operating activities .................................. 11,501 7,199 (5,547)
Changes in assets and liabilities:
Decrease (increase) in receivables ......................... 60,273 126,131 133,162
Decrease (increase) in inventories ......................... (87,724) 37,583 249,849
Net decrease (increase) in prepaid expenses and other assets ..... 2,522 28,165 (16,986)
Net increase (decrease) in accounts payable, accrued expenses
and other long-term liabilities ........................... (69,144) 15,408 (178,554)
Total adjustments ........................................ 249,331 895,163 1,949,259
Net cash provided by operating activities .......................... 203,126 296,439 468,256
Cash flows from investing activities:
Capital expenditures ........................................ (169,452) (130,847) (330,075)
Acquisitions, net of cash acquired, and related payments ........... (10,952) — (102,752)
Purchase of assets held for sale and sold ........................ —— (38,537)
Proceeds from disposition of assets and other .................... 35,393 150,131 120,632
Restricted cash for pending transaction ......................... (46,509) — (6,037)
Release of restricted cash .................................... —6,037 18,100
Net cash provided by (used in) investing activities .................. (191,520) 25,321 (338,669)
Cash flows from financing activities:
Net proceeds from exercise of stock options and sale of stock under
employee stock purchase plans .............................. 1,011 35 503
Tax benefit from employee share-based exercises ................. ——89
Treasury stock additions from employee related plans .............. —— (944)
Payment for non-controlling interests ........................... (21,786) ——
Debt issuance costs ......................................... (4,688) — (40,793)
Proceeds from issuance of redeemable preferred stock, net .......... —324,801 —
Dividends on redeemable preferred stock ........................ (27,639) ——
Proceeds from issuance of borrowings .......................... 52,488 24,321 139,098
Payments on long- and short-term borrowings .................... (30,284) (175,863) (284,204)
Net cash provided by (used in) financing activities .................. (30,898) 173,294 (186,251)
Effect of exchange rate changes on cash and cash equivalents ....... (13,128) 9,099 (10,545)
Net increase (decrease) in cash and cash equivalents .............. (32,420) 504,153 (67,209)
Cash and cash equivalents at beginning of period ................... 659,898 155,745 222,954
Cash and cash equivalents at end of period ........................ $ 627,478 $ 659,898 $ 155,745
The accompanying Notes to Consolidated Financial Statements are an integral part of these statements.
36