Nordstrom 1999 Annual Report Download - page 52
Download and view the complete annual report
Please find page 52 of the 1999 Nordstrom annual report below. You can navigate through the pages in the report by either clicking on the pages listed below, or by using the keyword search tool below to find specific information within the annual report.-
 1
1 -
2
-
3
-
4
-
5
-
6
-
7
-
8
-
9
-
10
-
11
-
12
-
13
-
14
-
15
-
16
-
17
-
18
-
19
-
20
-
21
-
22
-
23
-
24
-
25
-
26
-
27
-
28
-
29
-
30
-
31
-
32
-
33
-
34
-
35
-
36
-
37
-
38
-
39
-
40
-
41
-
 42
42 -
 43
43 -
 44
44 -
 45
45 -
 46
46 -
 47
47 -
 48
48 -
 49
49 -
 50
50 -
 51
51 -
 52
52 -
 53
53 -
 54
54 -
 55
55 -
 56
56 -
 57
57 -
 58
58 -
 59
59 -
 60
60 -
 61
61 -
 62
62
 |
 |

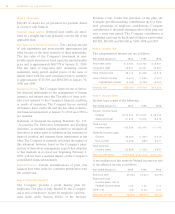
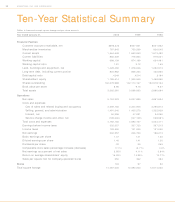
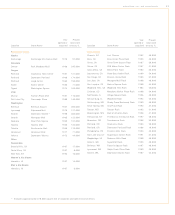
NORDSTROM, INC. AND SUBSIDIARIES
50
Ten-Year Statistical Summary
Dollars in thousands except square footage and per share amounts
Year ended January 31, 2000 199 9 1998
Financial Position
Customer accounts receivable, net $596,020 $567,661 $641,862
Merchandise inventories 797,845 750,269 826,045
Current assets 1,564,648 1,653,063 1,613,492
Current liabilities 866,509 778,864 979,031
Working capital 698,139 874,199 634,461
Working capital ratio 1.81 2.12 1.65
Land, buildings and equipment, net 1,429,492 1,378,006 1,252,513
Long-term debt, including current portion 804,982 868,234 420,865
Debt/capital ratio .4249 .4214 .3194
Shareholders’ equity 1,185,614 1,300,545 1,458,950
Shares outstanding 132,279,988 142,114,167 152,518,104
Book value per share 8.96 9.15 9.57
Total assets 3,062,081 3,088,063 2,890,664
Operations
Net sales 5,124,223 5,027,890 4,851,624
Costs and expenses:
Cost of sales and related buying and occupancy 3,359,760 3,344,945 3,295,813
Selling, general, and administrative 1,491,040 1,405,270 1,322,929
Interest, net 50,396 47,091 34,250
Service charge income and other, net (109,030) (107,139) (108,581)
Total costs and expenses 4,792,166 4,690,167 4,544,411
Earnings before income taxes 332,057 337,723 307,213
Income taxes 129,500 131,000 121,000
Net earnings 202,557 206,723 186,213
Basic earnings per share 1.47 1.41 1.20
Diluted earnings per share 1.46 1.41 1.20
Dividends per share .32 .30 .265
Comparable store sales percentage increase (decrease) (1.1%) (2.7%) 4.0%
Net earnings as a percent of net sales 3.95% 4.11% 3.84%
Return on average shareholders’ equity 16.29% 14.98% 12.77%
Sales per square foot for Company-operated stores 350 362 384
Stores 104 97 92
Total square footage 14,487,000 13,593,000 12,614,000