Nordstrom 1999 Annual Report Download - page 33
Download and view the complete annual report
Please find page 33 of the 1999 Nordstrom annual report below. You can navigate through the pages in the report by either clicking on the pages listed below, or by using the keyword search tool below to find specific information within the annual report.-
 1
1 -
2
-
3
-
4
-
5
-
6
-
7
-
8
-
9
-
10
-
11
-
12
-
13
-
14
-
15
-
16
-
17
-
18
-
19
-
20
-
21
-
22
-
 23
23 -
 24
24 -
 25
25 -
 26
26 -
 27
27 -
 28
28 -
 29
29 -
 30
30 -
 31
31 -
 32
32 -
 33
33 -
 34
34 -
 35
35 -
 36
36 -
 37
37 -
 38
38 -
 39
39 -
 40
40 -
 41
41 -
 42
42 -
 43
43 -
44
-
45
-
46
-
47
-
48
-
49
-
50
-
51
-
52
-
53
-
54
-
55
-
56
-
57
-
58
-
59
-
60
-
61
-
62
 |
 |

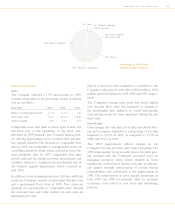
31NORDSTROM, INC. AND SUBSIDIARIES
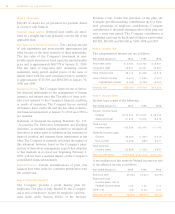
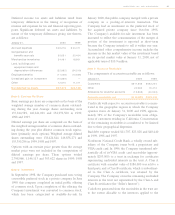
36% Women’s Apparel
21% Women’s Accessories
19% Shoes
18% Men’s Apparel
and Furnishings
4% Children’s Apparel
and Accessories
2% Other
Percentage of 1999 Sales
by Merchandise Category
Results of Operations
Sales
The Company achieved a 1.9% sales increase in 1999.
Certain components of the percentage change in sales by
year are as follows:
Fiscal Year 1999 1998 1997
Sales in comparable stores (1.1%) (2.7%) 4.0%
NORDSTROM.com 8.3% 33.0% 49.8%
Total increase 1.9% 3.6% 9.1%
Comparable store sales (sales in stores open at least one
full fiscal year at the beginning of the fiscal year)
decreased in 1999 primarily due to missed fashion prod-
uct offering opportunities in the women’s, kids’ and jun-
iors’ apparel divisions. The decrease in comparable store
sales in 1998 was attributable to management’s focus on
controlling inventory levels, which resulted in lower, but
more profitable, sales. In 1997, comparable store sales
growth reflected the strong economic environment and
a positive reaction to changes in the merchandise mix in
the women’s apparel departments, which occurred in
mid-1996.
In addition to the aforementioned new full-line and R ack
stores, the Company opened a replacement full-line store
and a replacement R ack store in 1999. New stores are
generally not as productive as “comparable stores” because
the customer base and traffic patterns of each store are
developed over time.
Sales at N ORD STRO M.com continued to contribute to the
Company’s sales growth with sales of $210 million, $194
million and $146 million in 1999, 1998 and 1997, respec-
tively.
The Company’s average price point has varied slightly
over the past three years, due primarily to changes in
the merchandise mix. Inflation in overall merchandise
costs and prices has not been significant during the past
three years.
Gross Margin
Gross margin (net sales less cost of sales and related buy-
ing and occupancy expenses) as a percentage of net sales
improved to 34.5% in 1999, as compared to 33.5% in
1998, and 32.1% in 1997.
The 1999 improvement reflects changes in the
Company’s buying processes and vendor programs. The
1998 improvement was principally due to favorable pric-
ing strategies and the Company’s increased focus on
managing inventory levels, which resulted in lower
markdowns. A decrease in buying costs, due to efficien-
cies gained through restructuring of certain buying
responsibilities, also contributed to the improvement in
1998. The improvement in gross margin percentage in
both 1999 and 1998 was partially offset by increased
occupancy costs related to new stores and remodeling
projects.