Nordstrom 1999 Annual Report Download - page 47
Download and view the complete annual report
Please find page 47 of the 1999 Nordstrom annual report below. You can navigate through the pages in the report by either clicking on the pages listed below, or by using the keyword search tool below to find specific information within the annual report.-
 1
1 -
2
-
3
-
4
-
5
-
6
-
7
-
8
-
9
-
10
-
11
-
12
-
13
-
14
-
15
-
16
-
17
-
18
-
19
-
20
-
21
-
22
-
23
-
24
-
25
-
26
-
27
-
28
-
29
-
30
-
31
-
32
-
33
-
34
-
35
-
36
-
 37
37 -
 38
38 -
 39
39 -
 40
40 -
 41
41 -
 42
42 -
 43
43 -
 44
44 -
 45
45 -
 46
46 -
 47
47 -
 48
48 -
 49
49 -
 50
50 -
 51
51 -
 52
52 -
 53
53 -
 54
54 -
 55
55 -
 56
56 -
 57
57 -
58
-
59
-
60
-
61
-
62
 |
 |

45NORDSTROM, INC. AND SUBSIDIARIES
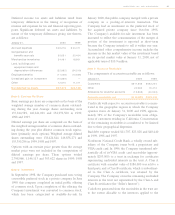
Note 13: Supplementary Cash Flow Information
Supplementary cash flow information includes the
following:
Year ended January 31 , 2000 1999 1998
Cash paid during
the year for:
Interest (net
of capitalized
interest) $ 54,195 $ 44,418 $ 35,351
Income taxes 129,566 126,157 126,606
Note 14: Segment Reporting
The Company has three reportable segments which have
been identified based on differences in products and
services offered and regulatory conditions: the R etail
Stores, Credit Operations, and Catalog/ Internet seg-
ments. The R etail Stores segment derives its sales from
high-quality apparel, shoes and accessories for women,
men and children, sold through retail store locations. It
includes the Company’s Product Development Group
which coordinates the design and production of private
label merchandise sold in the Company’s retail stores.
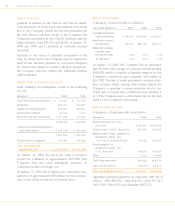
Credit Operations segment revenues consist primarily of
finance charges earned through issuance of the Nordstrom
proprietary and VISA credit cards. The Catalog/ Internet
segment generates revenues from direct mail catalogs and
the NORD STRO M .com and N ORD STRO Mshoes.com Web sites.
The Company’s senior management utilizes various
measurements to assess segment performance and to
allocate resources to segments. The measurements used
to compute net earnings for reportable segments are
consistent with those used to compute net earnings for
the Company.
The accounting policies of the operating segments are
the same as those described in the summary of significant
accounting policies in Note 1. Corporate and Other
includes certain expenses and a portion of interest
expense which are not allocated to the operating seg-
ments. Intersegment revenues primarily consist of fees for
credit card services and are based on fees charged by third
party cards.
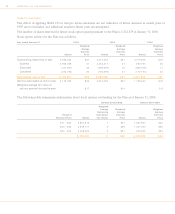
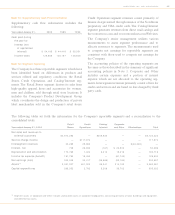
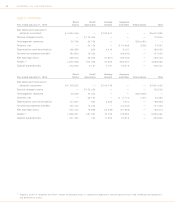
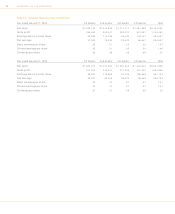
The following tables set forth the information for the Company’s reportable segments and a reconciliation to the
consolidated totals:
Retail Credit Catalog/ Corporate
Year ended January 31 , 2000 Stores Operations Internet and Other Eliminations Total
Net sales and revenues to
external customers $4,914,293 — $209,930 — — $5,124,223
Service charge income — $117,974 — — — 117,974
Intersegment revenues 20,285 25,963 — — $(46,248) —
Interest, net 728 26,933 (167) $ 22,902 — 50,396
Depreciation and amortization 170,765 1,424 6,313 15,216 — 193,718
Income tax expense (benefit) 191,790 19,450 — (81,740) — 129,500
Net earnings (loss) 300,009 30,417 (35,685) (92,184) — 202,557
Assets(a) 2,051,327 601,320 95,241 314,193 — 3,062,081
Capital expenditures 263,352 2,792 5,206 33,702 — 305,052
(a) Segment assets in Corporate and Other include unallocated assets in corporate headquarters, consisting primarily of land, buildings and equipment,
and deferred tax assets.