Nordstrom 1999 Annual Report Download - page 34
Download and view the complete annual report
Please find page 34 of the 1999 Nordstrom annual report below. You can navigate through the pages in the report by either clicking on the pages listed below, or by using the keyword search tool below to find specific information within the annual report.-
 1
1 -
2
-
3
-
4
-
5
-
6
-
7
-
8
-
9
-
10
-
11
-
12
-
13
-
14
-
15
-
16
-
17
-
18
-
19
-
20
-
21
-
22
-
23
-
 24
24 -
 25
25 -
 26
26 -
 27
27 -
 28
28 -
 29
29 -
 30
30 -
 31
31 -
 32
32 -
 33
33 -
 34
34 -
 35
35 -
 36
36 -
 37
37 -
 38
38 -
 39
39 -
 40
40 -
 41
41 -
 42
42 -
 43
43 -
 44
44 -
45
-
46
-
47
-
48
-
49
-
50
-
51
-
52
-
53
-
54
-
55
-
56
-
57
-
58
-
59
-
60
-
61
-
62
 |
 |

NORDSTROM, INC. AND SUBSIDIARIES
32
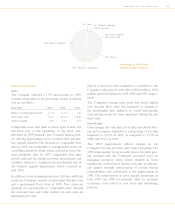
Selling, General, and Administrative
Selling, general, and administrative expenses as a percent-
age of net sales were 29.1% in 1999, 28.0% in 1998, and
27.3% in 1997.
The 1999 increase, as a percentage of net sales, was due to
the aforementioned $10 million of pre-tax restructuring
charges. In addition, the Company incurred substantial
additional costs associated with the accelerated develop-
ment of NORD STROM.com and N ORD STRO Mshoes.com. In
August 1999, the Company announced that, compared to
its plan prior thereto, N O RDST ROM.com would increase
operating expenses by approximately $22 million over the
balance of the year, in order to accelerate growth and
development of its Internet business channel. The actual
increase for 1999 was $23 million. These increases were
partially offset by lower bad debt expense due to the
improved credit quality of the Company’s credit card
receivables.
The 1998 increase in selling, general, and administrative
expenses, as a percentage of net sales, was due to higher
sales promotion costs for the Company’s direct sales cata-
log division, and spending on Year 2000 compliance and
other information system operational costs. The increase
was partially offset by decreases in bad debt expenses
associated with the Company’s credit card business and
lower selling expenses, as a percentage of sales.
Interest Expense, Net
Interest expense, net increased 7% in 1999 and 37% in
1998 as a result of higher average borrowings to finance
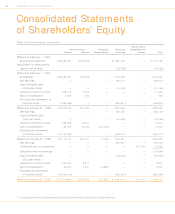
share repurchases.The Company repurchased 10.2 million
shares and 11.2 million shares at an aggregate cost of $303
million and $346 million in 1999 and 1998, respectively.
Service Charge Income and Other, Net
Service charge income and other, net primarily repre-
sents income from the Company’s credit card operations,
offset by miscellaneous expenses.
Service charge income and other, net was flat in 1999
and 1998, both in dollars and as a percent of sales.
Net Earnings
Net earnings for 1999 were slightly lower than 1998 as
the Company’s record sales and gross margin were offset
by increases in selling, general, and administrative expens-
es. Net earnings for 1998 increased as compared to 1997
primarily due to gross margin improvements.
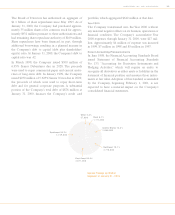
Liquidity and Capital Resources
The Company finances its working capital needs, capital
expenditures and share repurchase activity with cash pro-
vided by operations and borrowings.
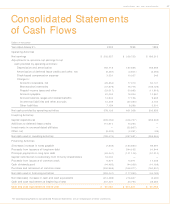
For the fiscal year ended January 31, 2000, net cash pro-
vided by operating activities decreased approximately
$223 million compared to the fiscal year ended January
31, 1999, primarily due to the non-recurring benefit of
prior year reductions in inventories and customer receiv-
able account balances. Net cash provided by operating
activities for the fiscal year ended January 31, 1999
increased by approximately $301 million as compared to
the fiscal year ended January 31, 1998, primarily due to a
reduction in merchandise inventories resulting from
management’s focus on managing inventory levels and a
decrease in customer receivable balances.
For the fiscal year ended January 31, 2000, net cash used in
investing activities decreased approximately $68 million
compared to the fiscal year ended January 31, 1999, prima-
rily due to an increase in funds provided by developers to
defray part of the Company’s costs of constructing new
stores. The Company’s capital expenditures aggregated
approximately $700 million over the last three years, net
of deferred lease credits, principally to add new stores and
facilities and to improve existing stores and facilities.
Over 2.7 million square feet of retail store space has been
added during this time period, representing an increase
of 23% since January 31, 1997.
The Company plans to spend approximately $1.0 billion,
net of deferred lease credits, on capital projects during the
next three years, including new stores, the remodeling of
existing stores, new systems and technology, and other
items. At January 31, 2000, approximately $80 million has
been contractually committed for the construction of
new stores or remodel of existing stores. Although the
Company has made commitments for stores opening in
2000 and beyond, it is possible that some stores may not
be opened as scheduled because of delays inherent in the
development process, or for other reasons. In addition to
its cash flow from operations, the Company has funds
available under its revolving credit facility. Management
believes that the Company’s current financial strength and
credit position enable it to maintain its existing stores and
to take advantage of attractive new opportunities.