Nordstrom 1999 Annual Report Download - page 50
Download and view the complete annual report
Please find page 50 of the 1999 Nordstrom annual report below. You can navigate through the pages in the report by either clicking on the pages listed below, or by using the keyword search tool below to find specific information within the annual report.-
 1
1 -
2
-
3
-
4
-
5
-
6
-
7
-
8
-
9
-
10
-
11
-
12
-
13
-
14
-
15
-
16
-
17
-
18
-
19
-
20
-
21
-
22
-
23
-
24
-
25
-
26
-
27
-
28
-
29
-
30
-
31
-
32
-
33
-
34
-
35
-
36
-
37
-
38
-
39
-
 40
40 -
 41
41 -
 42
42 -
 43
43 -
 44
44 -
 45
45 -
 46
46 -
 47
47 -
 48
48 -
 49
49 -
 50
50 -
 51
51 -
 52
52 -
 53
53 -
 54
54 -
 55
55 -
 56
56 -
 57
57 -
 58
58 -
 59
59 -
 60
60 -
61
-
62
 |
 |

NORDSTROM, INC. AND SUBSIDIARIES
48
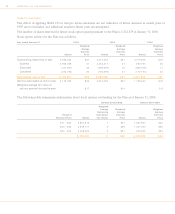
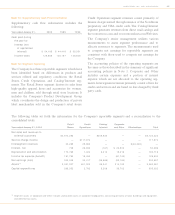
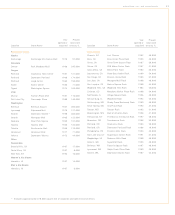
Note 16: Selected Quarterly Data (unaudited)
Year ended January 31 , 2000 1st Quarter 2nd Quarter 3rd Quarter 4 th Quarter Total
Net sales $1,039,105 $1,443,395 $1,110,114 $ 1,531,609 $ 5,124,223
Gross profit 350,909 500,047 392,270 521,237 1,764,463
Earnings before income taxes 51,688 116,189 55,033 109,147 332,057
Net earnings 31,538 70,839 33,633 66,547 202,557
Basic earnings per share .22 .51 .25 .50 1.47
Diluted earnings per share .22 .51 .25 .50 1.46
Dividends per share .08 .08 .08 .08 .32
Year ended January 31 , 1999 1st Quarter 2nd Quarter 3rd Quarter 4 th Quarter Total
Net sales $1,040,215 $1,447,284 $1,094,349 $ 1,446,042 $ 5,027,890
Gross profit 341,915 476,041 377,249 487,740 1,682,945
Earnings before income taxes 52,837 113,062 63,175 108,649 337,723
Net earnings 32,337 69,162 38,675 66,549 206,723
Basic earnings per share .22 .47 .27 .47 1.41
Diluted earnings per share .21 .47 .27 .47 1.41
Dividends per share .07 .07 .08 .08 .30