Navy Federal Credit Union 2012 Annual Report Download - page 30
Download and view the complete annual report
Please find page 30 of the 2012 Navy Federal Credit Union annual report below. You can navigate through the pages in the report by either clicking on the pages listed below, or by using the keyword search tool below to find specific information within the annual report.-
 1
1 -
2
-
3
-
4
-
5
-
6
-
7
-
8
-
9
-
10
-
11
-
12
-
13
-
14
-
15
-
16
-
17
-
18
-
19
-
 20
20 -
 21
21 -
 22
22 -
 23
23 -
 24
24 -
 25
25 -
 26
26 -
 27
27 -
 28
28 -
 29
29 -
 30
30 -
 31
31 -
 32
32 -
 33
33 -
 34
34 -
 35
35
 |
 |

Navy Federal Credit Union40 Leading with Vision. Achieving Results. 41
2012 Financial Section
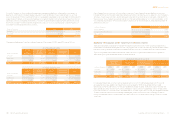
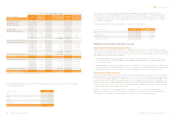
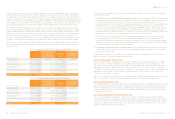
Fair Value at December 31, 2011
(dollars in thousands)
Quoted Prices
in Active
Markets for
Identical
Assets
(Level 1)
Significant
Other
Observable
Inputs
(Level 2)
Significant
Unobservable
Inputs
(Level 3)
Balance
as of
December 31,
2011
Available-for-sale
U.S. government and federal agency securities $ — $ 5,728,404 $ — $ 5,728,404
Residential mortgage-backed securities — 4,585,224 — 4,585,224
Commercial mortgage-backed securities — 14,781 — 14,781
Bank notes — 858,277 — 858,277
Total available-for-sale — 11,186,686 — 11,186,686
Mortgage loans awaiting sale — 692,740 — 692,740
Mortgage servicing rights — — 142,368 142,368
Other assets—Derivative commitments — 20,748 — 20,748
Total assets at fair value on a
recurring basis — 11,900,174 142,368 12,042,542
Other liabilities—Derivative commitments — 7,636 — 7,636
Total liabilities at fair
value on a recurring basis $ — $ 7,636 $ — $ 7,636
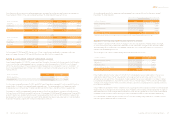
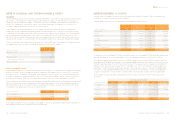
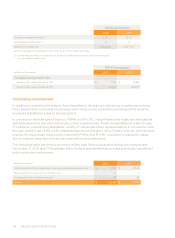
The following tables summarize the changes in fair value for items measured at fair value (Level 3) on
a recurring basis using significant unobservable inputs at December 31, 2012 and December 31, 2011:
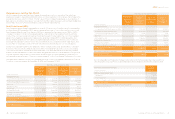
Fair Value at December 31, 2012 Mortgage
servicing
rights
(dollars in thousands)
Balance, beginning of year $ 142,368
Originations 52,773
Payos/Maturities (39,642)
(Loss) on changes in value of MSRs (11,410)
Balance, end of year $ 144,089
Change in unrealized gains/(losses) related to financial instruments
still held at December 31, 2012 $ (12,650)
Mortgage Loans Awaiting Sale (MLAS)
MLAS comprise those loans that Navy Federal intends either to sell or to securitize. The initial loan
level basis is equal to unpaid principal balance plus or minus origination costs and fees. Navy Federal has
elected the fair value option for MLAS. The fair value of MLAS is determined based on an evaluation of
best execution forward contract prices sourced from the TBA market, by agency (Ginnie Mae/Freddie Mac/
Fannie Mae). As such, MLAS are classified as Level 2 in the fair value hierarchy.
Real Estate Owned (REO)
Navy Federal acquires residential properties as a result of foreclosure or forfeiture, and those properties
are classified as REO properties. REOs are recognized at the lower of cost or fair value less costs to sell.
Navy Federal utilizes Broker Price Opinions (BPOs) to estimate the fair market value of REOs. A BPO
considers the value of similar surrounding properties, sales trends in the neighborhood, an estimate
of any of the costs associated with getting the property ready for sale, and/or the cost of any needed
repairs. Navy Federal evaluates reasonableness by obtaining multiple BPOs on REO properties and
also by analyzing significant fluctuations on a period-by-period basis. Fair value less costs to sell is an
estimated value based on relevant recent historical data that are considered unobservable inputs, and
as such, REO is classified as Level 3 in the fair value hierarchy and valued on a non-recurring basis.
During the holding period, BPOs are updated to reflect changes in fair value, and the REO is carried at
the lower of the amount recorded at acquisition date or estimated fair value less costs to sell. Holding
costs such as insurance, maintenance, taxes, and utility costs are expensed as incurred. Navy Federal
markets the REO properties for sale to the public and generally does not hold properties for longer than
one year. Valuation adjustments on these assets as well as gains or losses realized from disposition of
such properties are reflected in “Other non-interest expense” on the Consolidated Statements of Income.
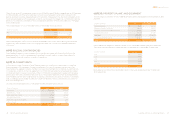
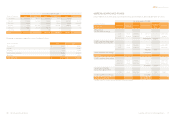
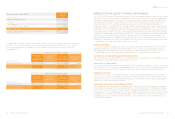
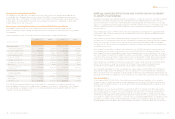
The tables below present the items recognized at fair value on the Consolidated Statements of Financial
Condition on a recurring basis at December 31, 2012 and December 31, 2011:
Fair Value at December 31, 2012
(dollars in thousands)
Quoted Prices
in Active
Markets for
Identical
Assets
(Level 1)
Significant
Other
Observable
Inputs
(Level 2)
Significant
Unobservable
Inputs
(Level 3)
Balance
as of
December 31,
2012
Available-for-sale
U.S. government and federal agency securities $ — $ 6,301,788 $ — $ 6,301,788
Residential mortgage-backed securities — 4,673,993 — 4,673,993
Commercial mortgage-backed securities — 14,988 — 14,988
Bank notes — 1,579,751 — 1,579,751
Municipal securities — 98,075 — 98,075
Mutual funds 10,928 — — 10,928
Total available-for-sale 10,928 12,668,595 — 12,679,523
Mortgage loans awaiting sale — 1,442,868 — 1,442,868
Mortgage servicing rights — — 144,089 144,089
Other assets—Derivative commitments — 51,842 — 51,842
Total assets at fair value on a
recurring basis 10,928 14,163,305 144,089 14,318,322
Other liabilities—Derivative commitments — 7,597 — 7,597
Total liabilities at fair
value on a recurring basis $ — $ 7,597 $ — $ 7,597